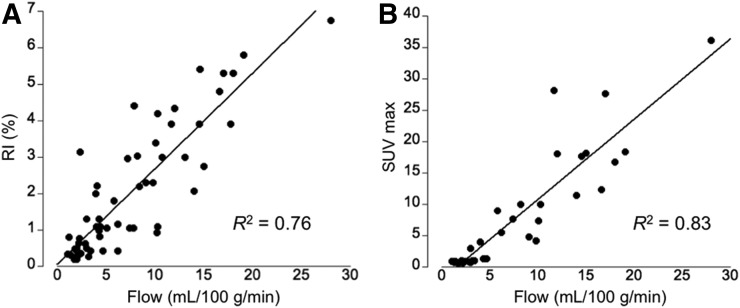
FIGURE 4.
(A) Linear relationship between blood flow (mL/100 g/min) and sympathetic innervation as measured using RI at location of supraclavicular BAT and subcutaneous WAT during both rest and cold exposure. (B) Linear relationship between blood flow and SUVmax at location of supraclavicular BAT and subcutaneous WAT during cold exposure.

