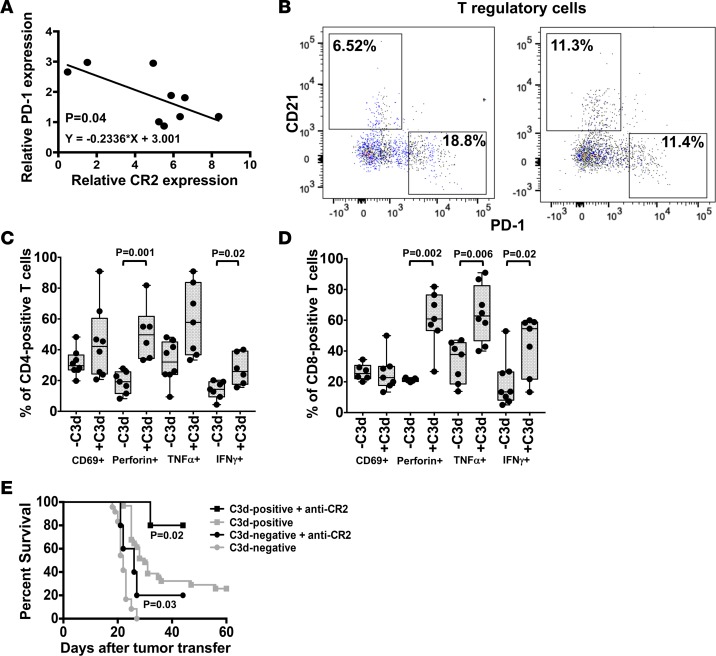
Figure 5. C3d modifies antitumor T cell functions.
(A) CR2 and PD-1 expression measured by qPCR on Tregs. Expression of CR2 and PD-1 were relative to that of GAPDH. (B) Flow cytometry analysis of lymphocytes obtained from the spleen of mice 10 days after injection of 5 × 10³ lymphoma cells. Figure shows reciprocal expression of CD21 and PD-1 by Tregs (CD4+, Foxp3+). (C and D) Figure shows the percent (%) of CD4+ (C) or CD8+ (D) T cells isolated from the spleen of recipients of C3d+ or C3d– tumors that express perforin, TNFα, and IFNγ, 3.5 hours after culture on anti-CD3– and anti-CD2–coated plates. Boxes in graphs represent distribution of data between the 25th and the 75th percentiles. The mean is indicated by a horizontal line, and whiskers represent maximum and minimum values. Statistical analysis was by the Mann Whitney 2-tailed test. (E) Impact of anti-CR2 antibodies on survival of mice given C3d+ or C3d– lymphoma cells. Anti-CD21/CD35 (7G6) antibodies were administered at the same time as tumor cells. Figure represents Kaplan-Meier plots obtained with at least 5 mice per condition, and differences between curves were analyzed by the log rank Mantel-Cox test. Note, the C3d-positive tumor and C3d-negative tumor groups in (E) are the same data as presented in Figure 1A. The data were not collected contemporaneously as the other groups in (E), but are shown here for reference.

