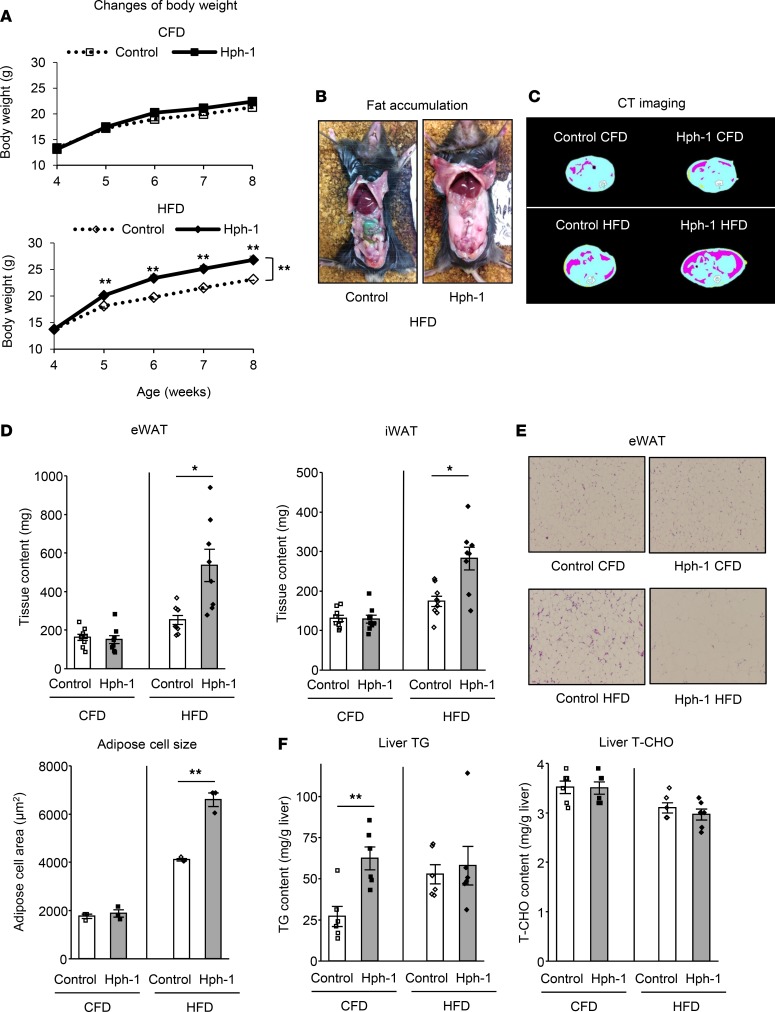
Figure 1. BH4-deficient mice exhibit obesity and adiposity.
(A) Body weight changes in hph-1 mice and control mice of the same background under control fat diet (CFD) or high-fat diet (HFD) for 4 weeks from the age of 4 weeks (n = 9). (B) Fat accumulation in hph-1 mice and control mice under HFD for 4 weeks. (C–F) CT imaging of adipose distribution (C), fat volume of epididymal and inguinal white adipose tissues (eWAT and iWAT) (D; n = 8–9), H&E staining and white adipose cell size of eWAT (E; n = 3) (original magnification, ×10), liver triglyceride (TG) and total cholesterol (T-CHO) contents (F; n = 6) under CFD or HFD for 4 weeks. Values are mean ± SEM. Statistical analysis was performed by 2-way ANOVA with Bonferroni post-hoc test (A) or Student’s t test (D–F). *P < 0.05, **P < 0.01 vs. control group.

