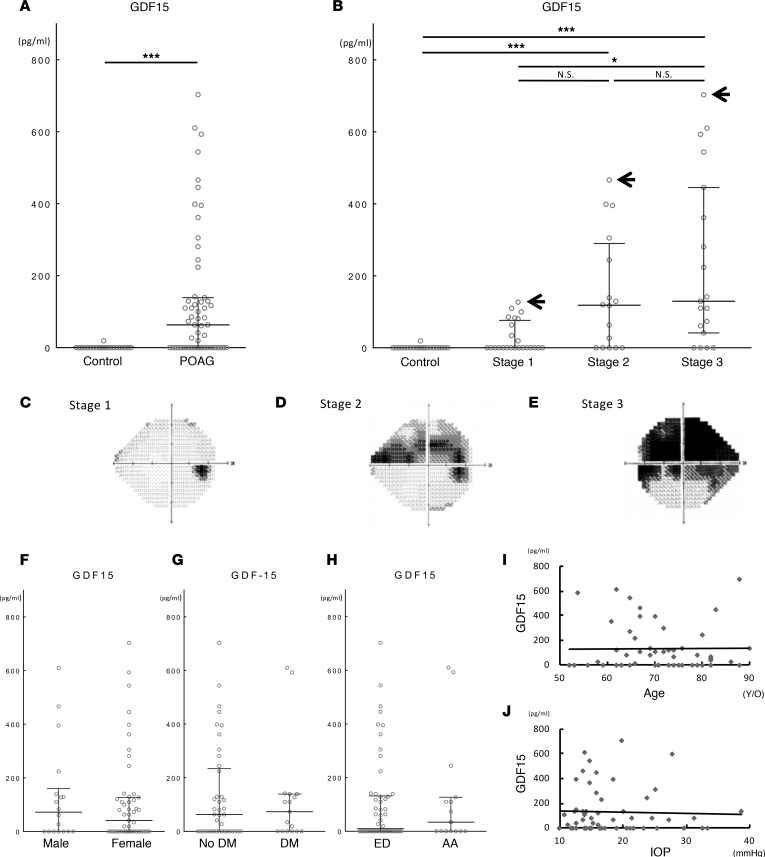
Figure 6. Elevated GDF15 level in aqueous humor (AH) of primary open angle glaucoma (POAG) patients.
(A) GDF15 protein level in AH of control patients (n = 23) and POAG patients (n = 57). ***P < 0.001 by Mann Whitney U test. (B) GDF15 protein level in control patients (n = 23) and POAG stage 1 (n = 23), stage 2 (n = 15), and stage 3 (n = 19) patients. P < 0.001 by Kruskal-Wallis test. *P < 0.05 and ***P < 0.001 by Dunn’s multiple comparison. Arrows in the graph indicate an individual case for each stage of POAG with the highest GDF15 level in AH for which the visual fields are illustrated. (C–E) Representative visual field images of POAG patient for (C) stage 1: 76 y/o, male, OD, MD: –1.63, GDF15: 126.8 pg/ml; (D) stage 2: 67 y/o, male, OD, MD: –10.82, GDF15: 466.1 pg/ml; and (E) stage 3: 88 y/o, female, OS, MD: –18.01, GDF15: 703.1 pg/ml. OD, oculus dexter (right eye); OS, oculus sinister (left eye); MD, mean deviation. (F–H) GDF15 protein level in AH of POAG patients did no differ by (F) sex: male (n = 18) vs. female (n = 39), (G) diabetes status: patients without DM (no DM: n = 41) vs. with DM (DM: n = 16), or (H) race: European descent (ED: n = 42) vs. African American (AA: n = 15). (I) Correlation between age and GDF15 protein level in AH of POAG patients (n = 57, Pearson Correlation Coefficient = 0.052, 95% CI: –3.08 to 4.82, P = 0.662). (J) Correlation between average IOP and GDF15 protein level in AH of POAG patients (n = 57, Pearson Correlation Coefficient = –0.037, 95% CI: –8.72 to 6.60, P = 0.78). Values are median with interquartile range.

