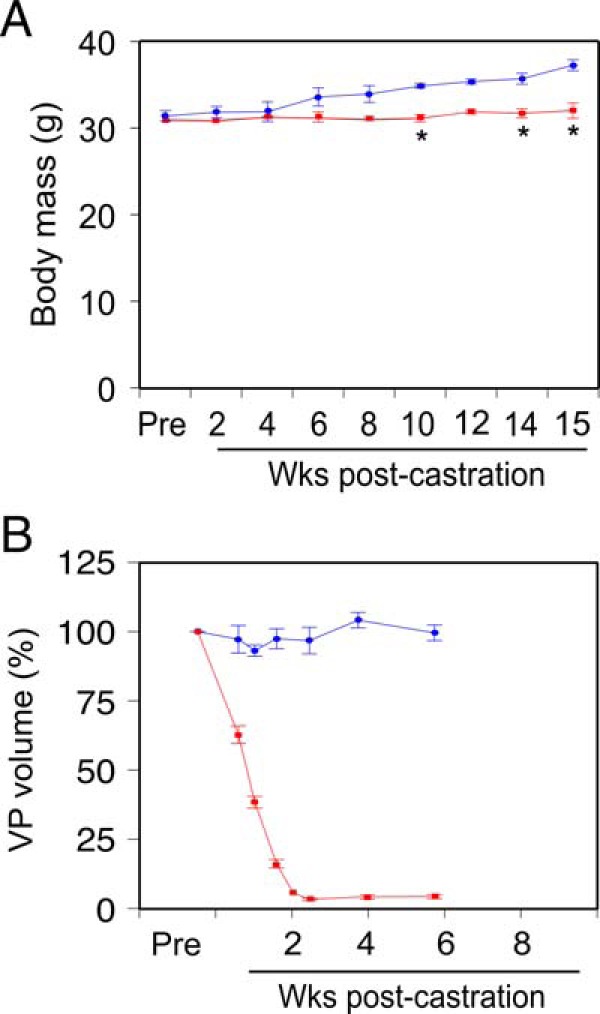
Figure 1. Castration induces prostate regression and affects body mass.

A, Total body mass in castrated (n = 4, red) or sham-castrated (n = 4, blue) mice, determined weekly. Mean (grams) ± SEM. B, Prostate glands were imaged by high frequency ultrasound before castration (Pre), and at the indicated times postcastration (n = 4, red) or postsham operation (n = 4, blue). Ventral prostate (VP) lobe volume was determined from ultrasound image reconstruction using Amira software and is shown as percent precastration volume (mean [%] ± SEM). Sham-castrated and castrated groups were compared using two-way ANOVA with Tukey's honest significant difference testing; *, P < .05 vs sham-castrated group.
