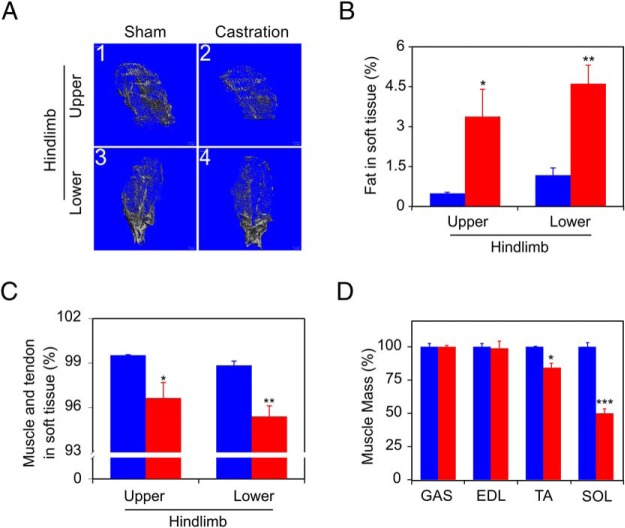
Figure 2. Castration induces sarcopenia.
A, Micro-CT images of mice from Figure 1 showing lean muscle (gray) and fat (empty area within lean tissue) tissue from upper hindlimb (1, sham femur; 2, castrated femur) and lower hindlimb (3, sham tibialis; 4, castrated tibialis) 14 weeks after castration. B, Fat in total soft tissue (mean fat mass, % of total; determined following subtraction of bone compartment volumes) is shown for sham-castrated (blue) and castrated (red) groups. C, Muscle and tendon in soft tissue (mean lean mass, % of total) were determined from analysis of micro-CT images for sham-castrated (blue) and castrated (red) groups. D, Muscle mass was determined at killing 15 weeks after castration for the indicated muscles (GAS, EDL, TA, and SOL), for sham-castrated (blue, set to 100% for each muscle type) and castrated (red) groups. Columns are mean (%), bars are SEM; n = 4 for each group. Groups were compared using unpaired t tests; *, P < .05; **, P < .01; ***, P < .001 vs sham-castrated group.

