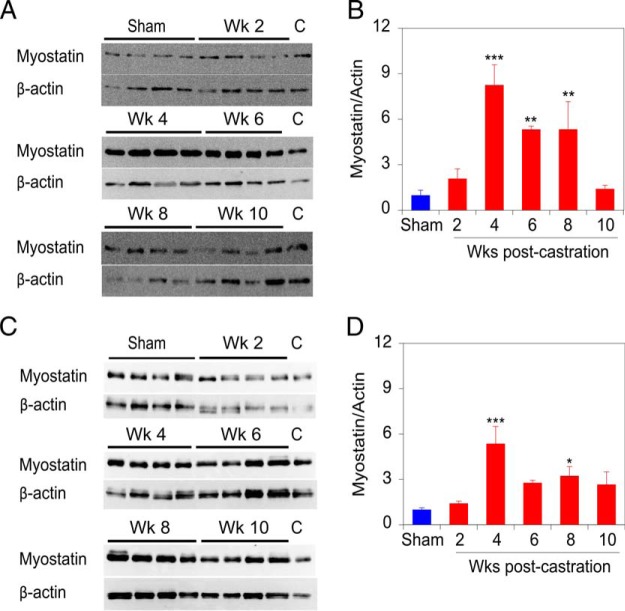
Figure 7. Castration induces myostatin protein levels in skeletal muscle.
A, Representative immunoblots of myostatin and β-actin (reprobing of the myostatin blot) expression in GAS muscle. B, Quantification of mean myostatin levels in GAS muscles from 4 mice at each time, assessed by 3 independent measurements. C, Representative immunoblot of myostatin and β-actin (reprobing of the myostatin blot) expression level in TRI muscle. Lanes of immunoblots marked (C) contain identical control sample for interblot comparison. D, Quantification of mean myostatin levels in TRI muscles from 4 mice at each time, assessed by 3 independent measurements. The values shown in B and D are relative to the sham-castrated (0-wk castrate) animals. Sham-castrated (blue) and castrated groups (red) were compared by one-way ANOVA with Dunnett's testing. Bars are SEM; *, P < .05; **, P < .01; ***, P < .001 vs sham-castrated group.

