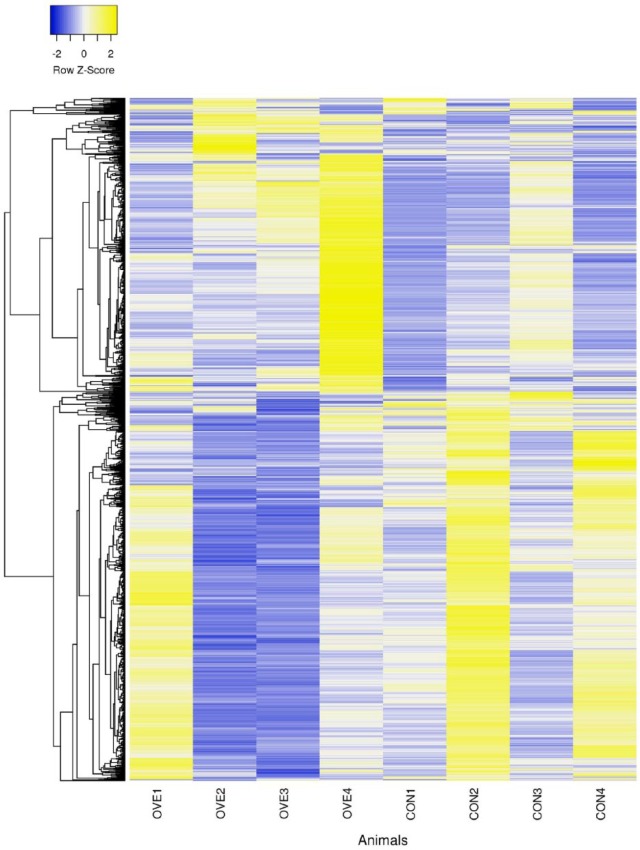
Figure 1.
Heat-map representation of signal intensity (average days −14 and +7) for differentially expressed genes (DEGs) in polymorphonuclear leukocytes of individual cows overfed energy (OVE) versus control fed (CON). The DEGs were clustered using the average linkage method, with distances calculated as Pearson coefficients.

