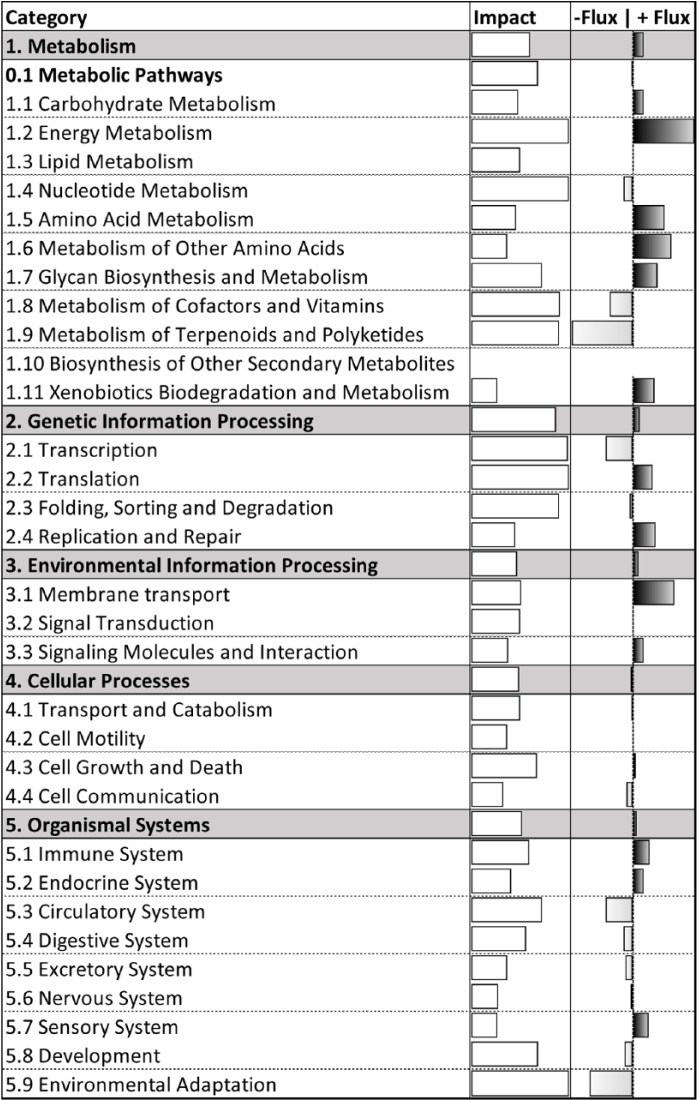
Figure 2.
Summary of treatment effects on all Kyoto Encyclopedia of Genes and Genomes pathways in polymorphonuclear leukocytes of overfed (OVE) versus control-fed (CON) cows, divided by category and subcategory. The second column of white bars indicates impact on a relative scale of 0 to 50. The third column of gray and black bars indicates flux, or direction of impact, on a scale of −25 to +25, where gray bars represent negative flux (−25 to 0) and black bars represent positive flux (0 to +25).

