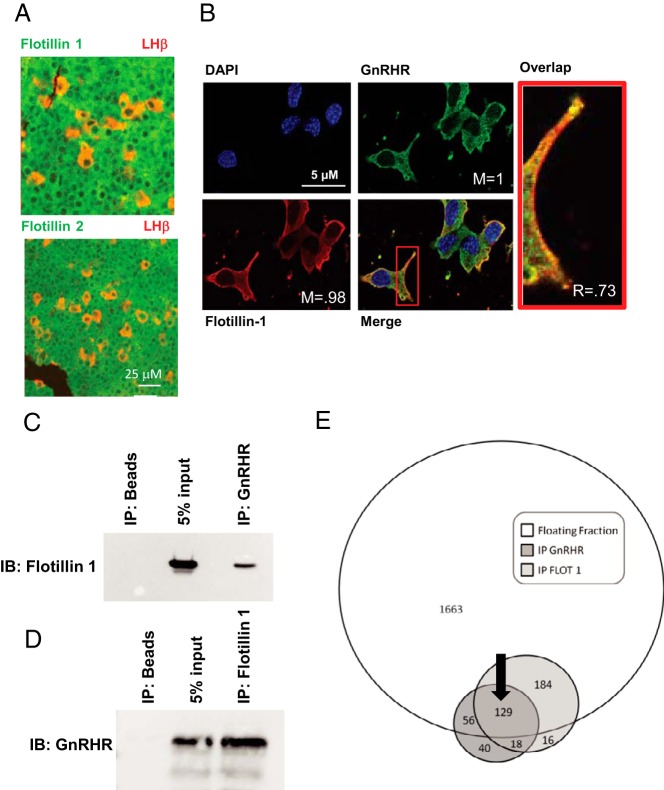
Figure 1. GnRHR and flotillin-1 localize in membrane rafts.
Studies focused on determining whether the GnRHR and flotillin-1 and flotillin-2 occupied overlapping raft domains. A, Fixed histological section from normal mouse anterior pituitary stained with antibodies for flotillin-1 or flotillin-2 (green) and the β-subunit to LH (red) used to identify the gonadotrope population. Magnification bar (25 μm) is shown in white. B, αT3–1 cells transfected with GnRHR-GFP fusion protein followed by staining for endogenous flotillin-1, a marker for raft domains at the plasma membrane. Localization of the 2 fluorophores was quantified using ImageJ's colocalization threshold plugin to calculate the Manders (M) and Pearsons coefficients (R). Magnification bars (5 μm) are shown in white. C and D, IP of the GnRHR and flotillin-1 (C and D, respectively) show reciprocal enrichment for flotillin-1 and the GnRHR in IPs from membrane rafts. All samples were precleared using preimmune serum. IP of beads alone was used as a negative control, whereas addition of 5% input from the original samples was used as a size marker for the IPs. IPs using a nonspecific antibody (GSK1) were also used as a negative control for flotillin-1 (data not shown). E, Venn diagram depicting the number of unique peptides identified in the whole raft fraction (floating fraction), the GnRHR (IP GnRHR), and flotillin-1 (IP FLOT 1) IPs using mass spectrometry. Individual numbers within each circle reflect the number of peptides detected. For example, 2032 peptides were detected within the floating fraction, only a portion of which overlap with the flotillin-1 and or GnRHR IP. The black arrow identifies the 129 peptides shared from all 3 mass spectrometry approaches.

