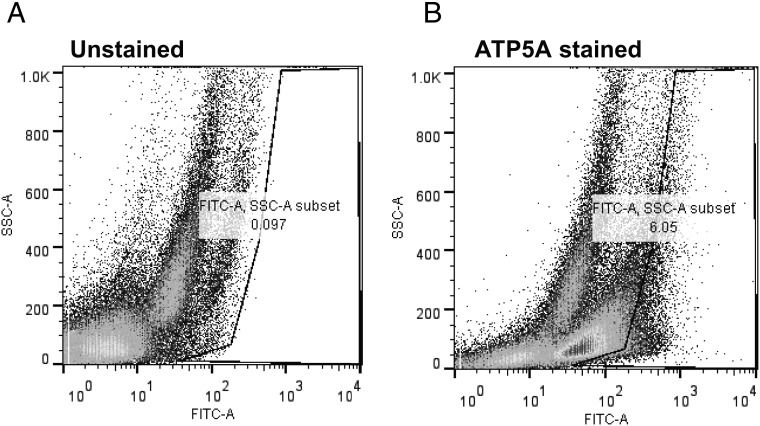
Figure 3. ATP5A immunoreactivity at the cell surface of αT3–1 cells.
Studies were carried out to determine the orientation of the F0F1 ATP synthase catalytic domain at the plasma membrane. Live αT3–1 cells were stained with fluorescein isothiocynate-conjugated antibody for ATP5A then subjected to flow cytometry. The left panel depicts unstained cells and the right panel depicts cells stained for ATP5A on the cell surface. FACS gates were set based upon data from the unstained αT3–1 cells.

