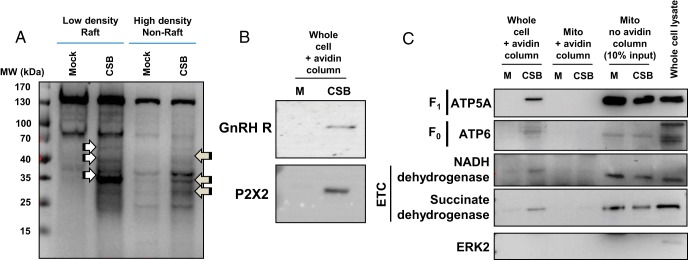
Figure 4. Cell surface biotinylation studies and orientation of the F0F1 ATP synthase catalytic domain.
To determine the cell surface orientation of the catalytic subunits of the F0F1 ATP synthase complex in αT3–1 cells, cell surface biotinylation studies were carried out and analyzed by Western blot analyses. A, Preliminary studies examined global cell surface biotinylation (CSB) in low and high density membrane fractions. The white and gray arrows depict specific enrichment of biotinylated proteins in low and high density membrane fractions. Molecular size standards (MW) are shown at the left of the panel. B, The GnRHR and the purinergic P2X2 receptor were identified at the plasma membrane in cell surface biotinylated cells but not in mock biotinylated cells as positive controls for this study (see Materials and Methods). C, CSB was carried in aT3–1 cells followed by mitochondrial extraction. Mock and CSB fractions were then analyzed by Western blot analysis for ATP5A (from the F1 complex), ATP6 (from the F0 complex), NADH dehydrogenase and succinate dehydrogenase (both from the electron transport chain or ETC), and ERK2 as a negative control. M, mock biotinylated; CSB, biotinylated samples; mito, enriched mitochondria.

