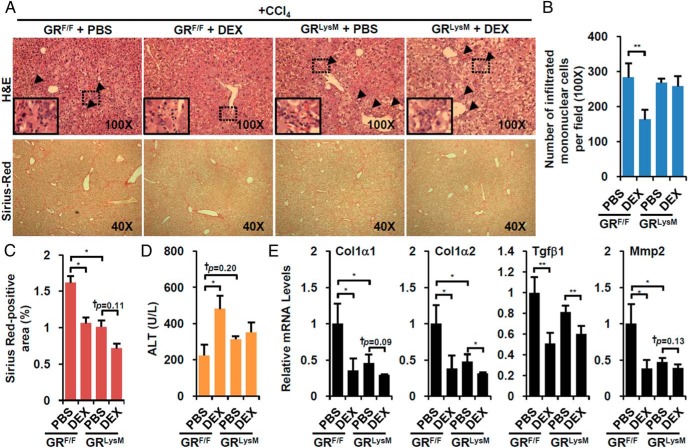
Figure 4. Immune cell-specific GR deletion reversed DEX effect on immune cell infiltration and liver injury.
A, CCl4-tretaed immune cell-specific GR knockout mice (GRLysM) and control littermates (GRF/F) were administered with vehicle (PBS, n = 3 per each genotype) or DEX-NaPO4 (DEX, n = 3 per each genotype). Representative liver sections stained with hematoxylin/eosin (H&E) (×100, upper) and Sirius red (×40, lower) are shown. Arrowhead indicates areas of infiltrating mononuclear cells. The number of infiltrated mononuclear cells (B), size of fibrotic area (C), and serum ALT level (D) were analyzed. E, Fibrotic gene expressions were quantified by Q-PCR analysis. Asterisks denote statistically significant differences (Student's t test; *, P < .05; **, P < .01; ***, P < .005; †, Cohen's d > 0.8).

