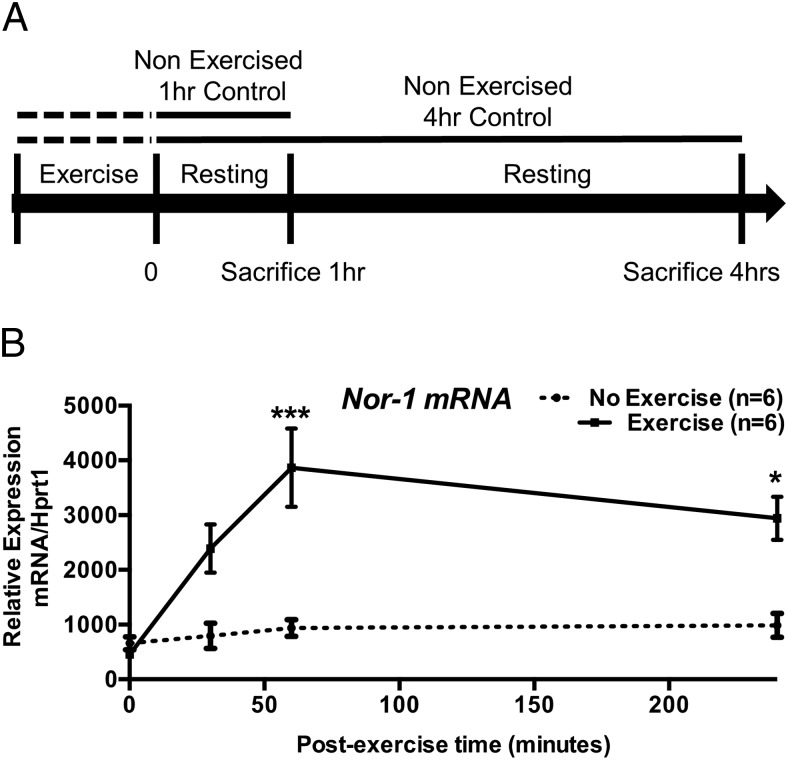
Figure 1. The expression of the mRNA encoding NR4A subgroup is induced after acute exercise in skeletal muscle.
A, Diagram illustrating the exercise protocol for tissues collected at 1 and 4 hours after exercise. B, Nor-1 qRT-PCR was performed on samples collected 0, 0.5, 1, and 4 hours after exercise quadriceps femoris skeletal muscle extracts (n = 6). Statistical calculation was performed using a Student's t test, and P values are indicated on graphs as follows: *, P < .05; **, P < .01; ***, P < .001.

