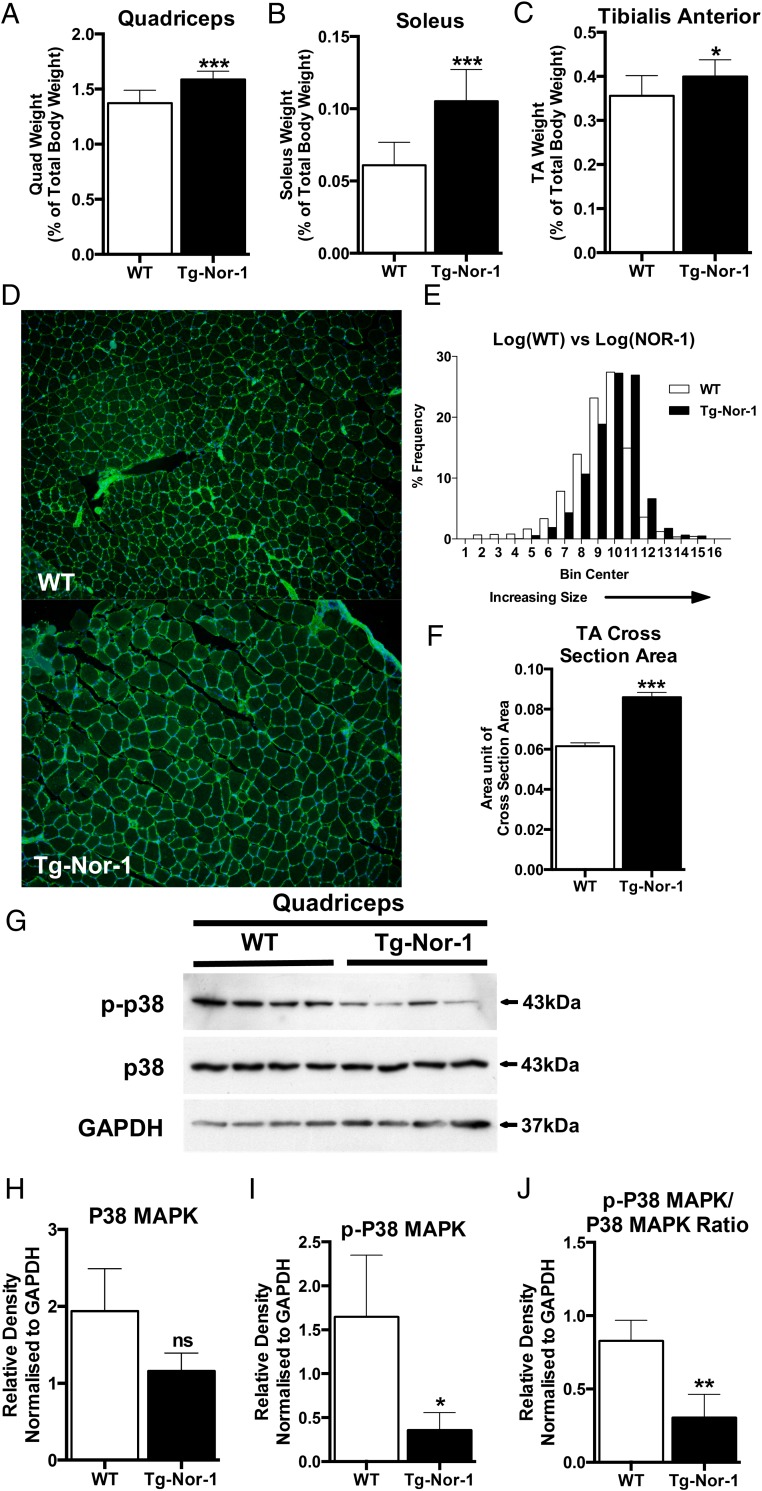
Figure 4. Transgenic Nor-1 expression is associated with increased skeletal muscle hypertrophy.
Skeletal muscle tissue was surgically removed from WT and Tg-Nor-1 mice and weighed for (A) quadriceps, (B) soleus, and (C) tibialis anterior. Values are expressed as percentage relative to total body weight (n = 10). D, WGA staining of the sarcolemma of tibialis anterior cross-sections from WT and Tg-Nor-1 mice. E, Histogram of distribution of fiber cross-section area sizes (n = 5). F, Average fiber cross-section area sizes in WT and Tg-Nor-1 mice (n = 5). G, Western blot analysis profiling autophagy markers performed on WT and Tg-Nor-1 mice (n = 4) quadriceps femoris tissue. H–J, Relative density normalized to GAPDH of Western blotting band intensity. Statistical calculation was performed using a Student's t test, and P values are indicated on graphs as follows: *, P < .05; **, P < .01; ***, P < .001.

