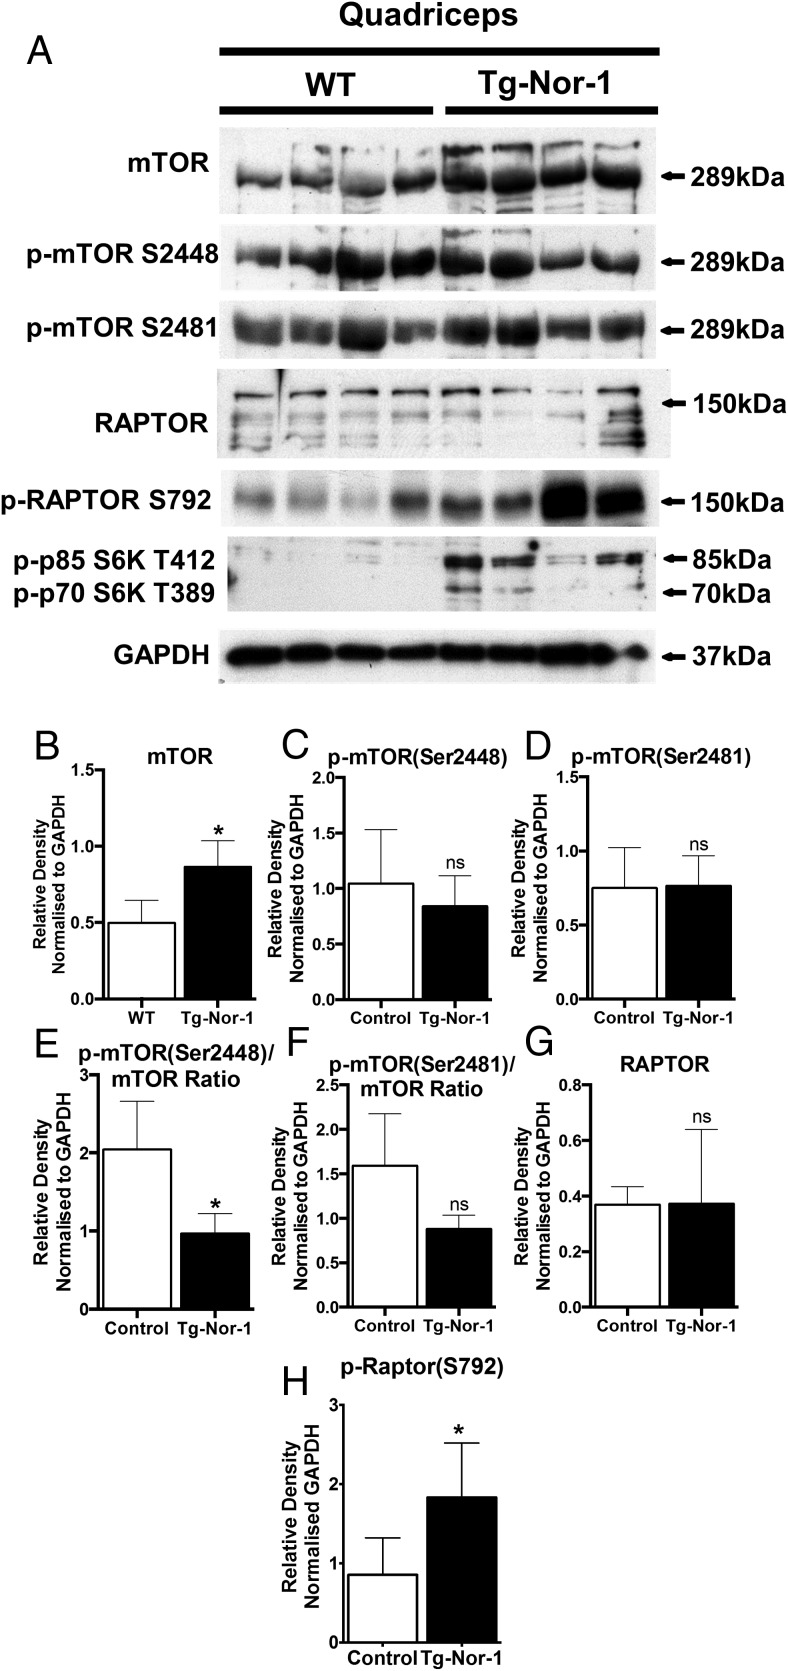
Figure 6. Nor-1 expression regulates components of mTORC1 in skeletal muscle.
A, Western blot analysis was performed on quadriceps femoris extracts from WT and Tg-Nor-1 skeletal muscle (n = 4) and assayed with mTOR markers. B–H, Relative density normalized to GAPDH of Western blotting band intensity. Statistical calculation was performed using a Student's t test, and P values are indicated on graphs as follows: *, P < .05; **, P < .01; ***, P < .001.

