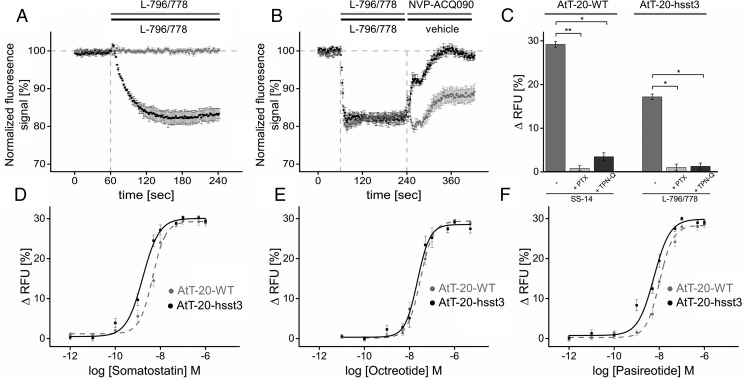
Figure 4. Membrane potential measurements.
A, Wild-type AtT-20 cells (gray trace) and AtT-20 cells stably expressing hsst3 (black trace) were exposed to a solution containing 10μM sst3-selective agonist L-796/778 to yield a final in-well concentration of 1μM. Changes in fluorescence signal intensity detected for wild-type cells were 0.6 ± 0.7% (mean ± SEM, n = 3, ns), respectively, 17.2 ± 2.3% (mean ± SEM, n = 4; *, P < .05). Shown is 1 representative experiment executed as triplicate (mean ± SD). Data indicated are composed of 3 independent experiments executed as triplicate vs vehicle injection as duplicates. Vehicle induced background changes in membrane potential were subtracted from agonist-induced signals. All values indicated are interpreted at t180sec. B, Inhibition of L-796/778-induced hyperpolarization by sst3-selective antagonist NVP-ACQ090. AtT-20 cells stably expressing wild-type sst3 were primarily exposed to 50μM L-796/778 at t60sec for 180 seconds (black and gray trace) and subsequently exposed to either a 50μM solution of NVP-ACQ090 at t240sec for another 180 seconds (black trace) or vehicle (gray trace). C, PTX and TPN-Q sensitivity of SS-14 and L-796/778-induced changes in membrane potential. Left panel, Exposure of wild-type AtT-20 cells with 10μM SS-14 induced a change of 29.2 ± 0.8% (mean ± SEM, n = 5) of the fluorescence signal (left bar). After pretreatment with 300-ng/mL PTX for 20 hours, signal magnitude significantly decreased to 1.8 ± 0.9% (mean ± SEM, n = 4; **, P < .01) after exposure to 10μM SS-14 (center bar) compared with untreated cells. In cells pretreated with 500nM TPN-Q for 5 minutes before agonist exposure (right bar), signal magnitude significantly decreased to 3.6 ± 0.9% (mean ± SEM, n = 5; *, P < .05). Right panel, AtT-20 cells stably expressing hsst3 were challenged with 10μM 796/778 (left bar) to induce a significant change in fluorescence signal of 17.2 ± 0.6% (mean ± SEM, n = 4). L-796/778 induced a significant decrease of fluorescence intensity in cells pretreated with PTX (1.0 ± 0.8%, mean ± SEM, n = 4; *, P < .05) or TPN-Q (1.3 ± 0.7%, mean ± SEM, n = 4; *, P < .05) compared with the untreated cells. D, Dose-response curves of wild-type AtT-20 cells vs hsst3-expressing cells stimulated with SS-14 in a concentration range from 1pM to 1μM. The EC50 value obtained was 4.5 ± 0.5nM for wild-type cells and 1.7 ± 0.3nM for hsst3-expressing cells. E, Dose-response curves of wild-type AtT-20 cells vs hsst3-expressing cells stimulated with octreotide in a concentration range from 10pM to 5μM with EC50 of 30.5 ± 4.6nM for wild-type cells and 30.5 ± 3.9nM for hsst3-expressing cells. F, Dose-response curves of wild-type AtT-20 cells vs hsst3-expressing cells stimulated with pasireotide in a concentration range from 1pM to 1μM with EC50 of 10.4 ± 0.8nM for wild-type cells and 5.8 ± 1.3nM for hsst3-expressing cells. EC50 values are given as mean ± SD. Results were analyzed by unpaired t test vs wild type.

