
Figure 2. The effects of FMO3 overexpression on insulin signaling and glycogen synthesis in lipid-treated human hepatocytes.
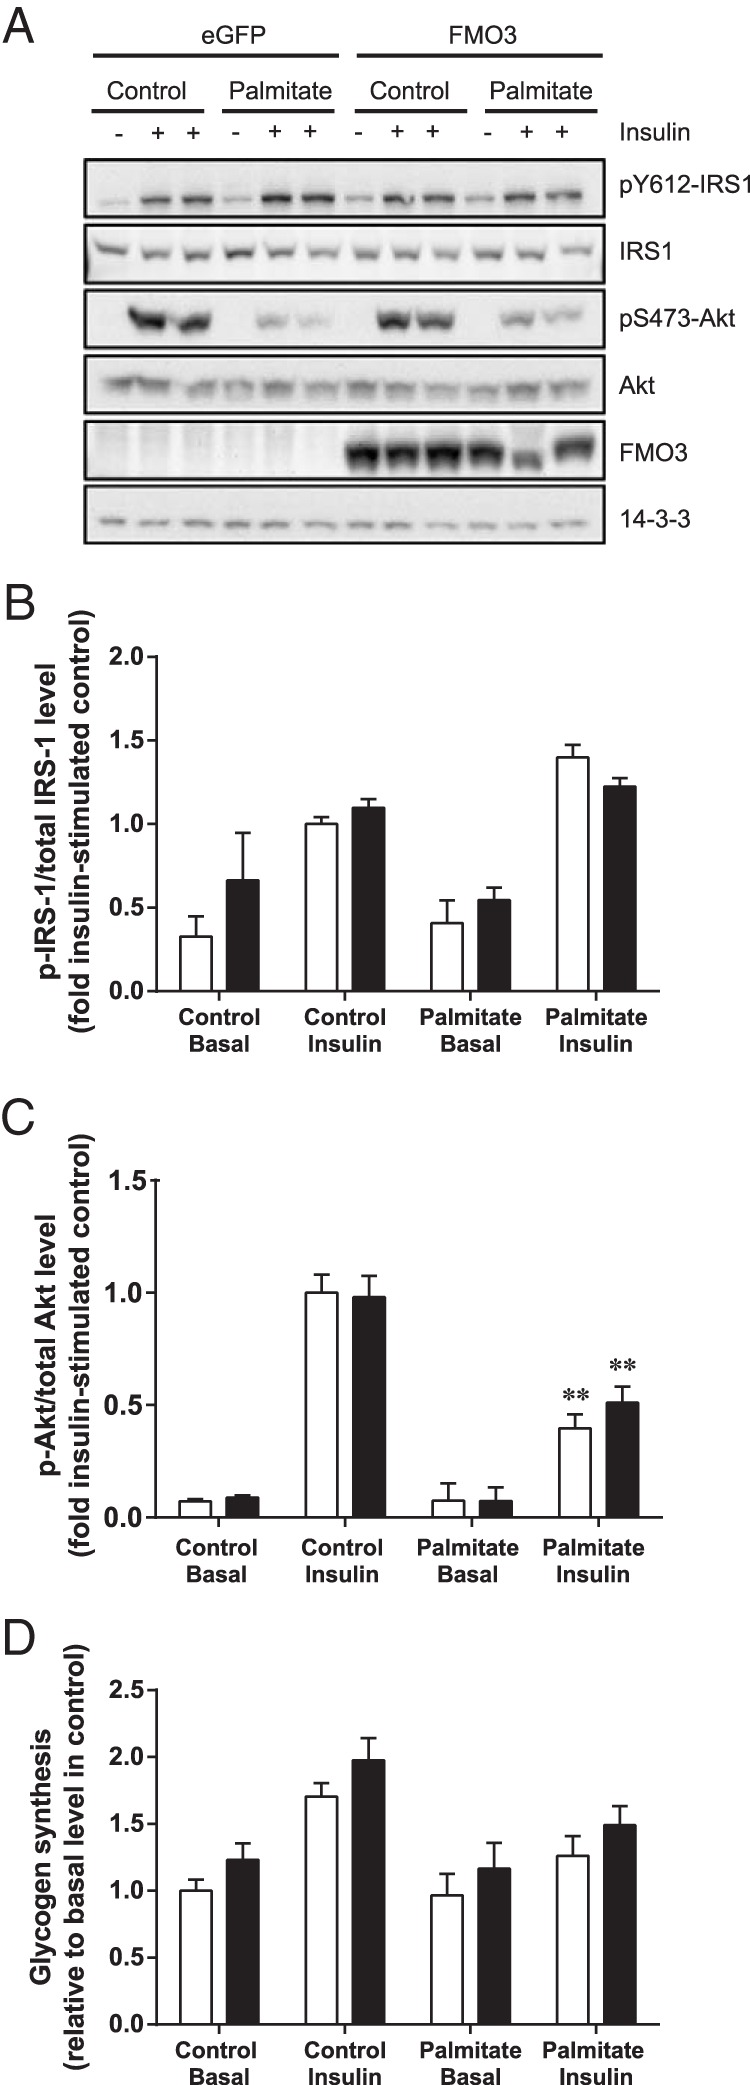
HepG2 cells were transfected with FMO3 cDNA (black bars), or eGFP cDNA (white bars) as control. Cells were incubated in the absence or presence of 0.75mM palmitate before stimulation with 100nM insulin. Cell lysates were subjected to immunoblotting to determine changes in IRS-1 and Akt phosphorylation and FMO3 expression. 14-3-3 was used as a loading control. Representative immunoblots from 4 independent experiments (A) and the mean ± SEM of densitometric analysis (B and C) are shown. Student's t test; **, P < .01 vs untreated cells. D, Glycogen synthesis was determined from the incorporation of [14C]glucose. Mean ± SEM from 5 independent experiments are shown. ANOVA, P < .02 for effect of plamitate in insulin-stimulated cells; P < .05 for effect of FMO3 overexpression.