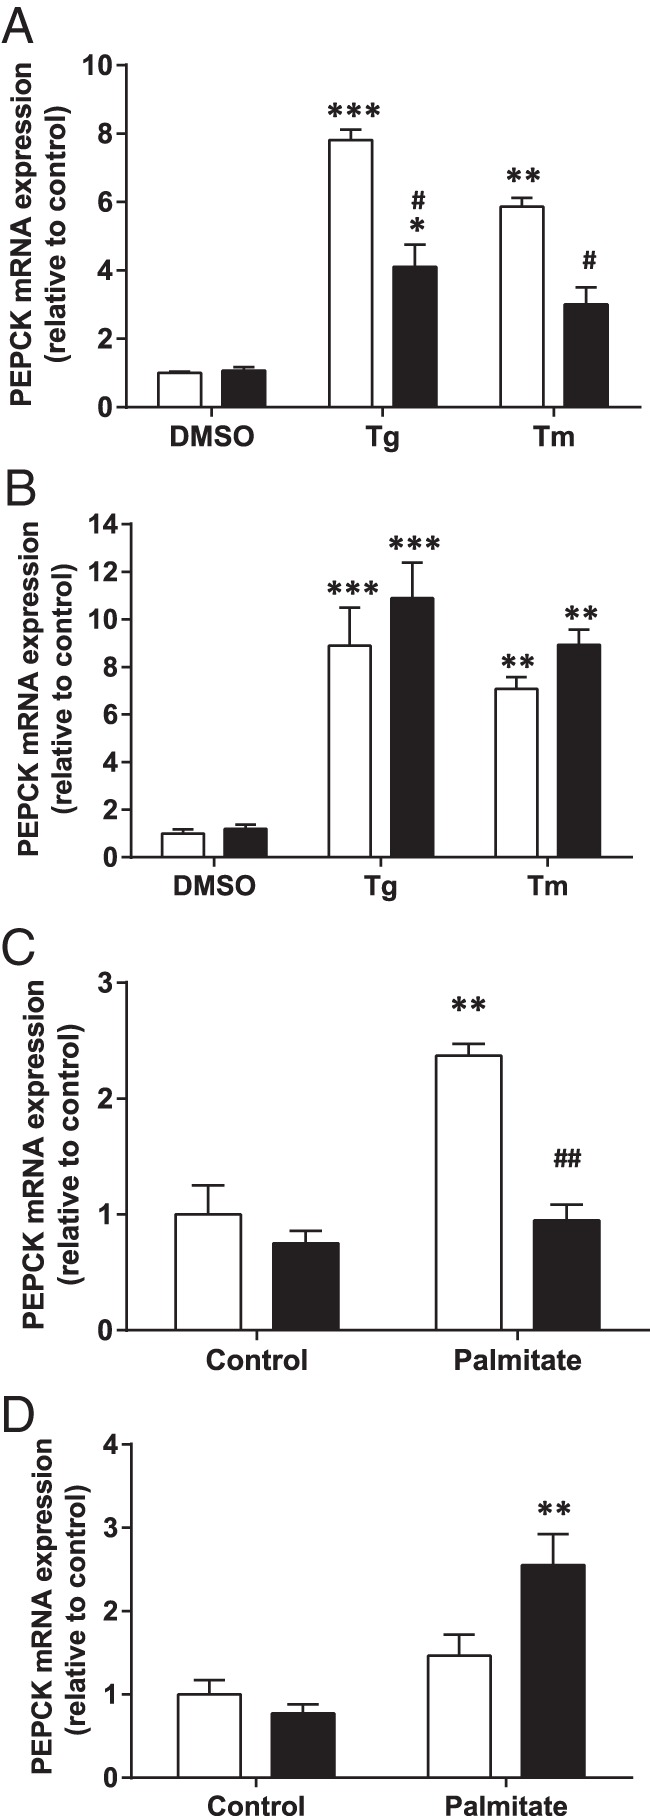
Figure 6. Effect of ER stress and FMO3 expression on PEPCK mRNA levels.

IHH hepatocytes either overexpressing FMO3 (A and C) or subjected to siRNA-mediated knockdown of FMO3 (B and D), were treated for 18 hours either with Tg, Tm, or vehicle to directly induce ER stress (A and B), or incubated for 18 hours without or with palmitate (C and D). In A–D, white bars represent control hepatocytes; black bars represent FMO3 overexpression or knockdown. In each case, PEPCK mRNA levels were determined by qRT-PCR. Means from 4 independent experiments are shown in each panel. Student's t test; **, P < .01; ***, P < .001 vs control; ##, P < .001 vs Tg-, Tm-, or palmitate-treated control hepatocytes.
