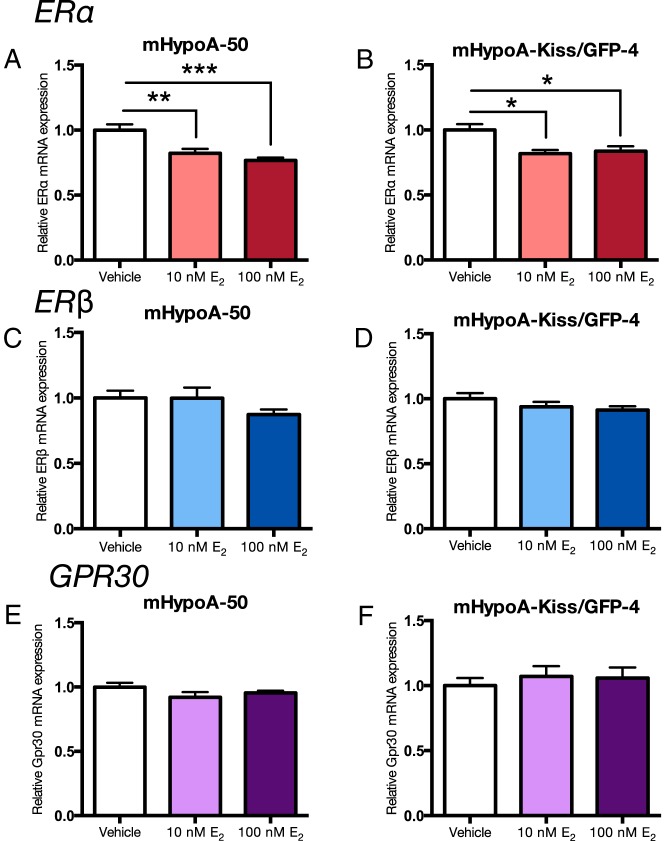
Figure 2. Effect of E2 treatment on ERα, ERβ, and Gpr30 mRNA expression in the mHypoA-50 and mHypoA-Kiss/GFP-4 AVPV cell lines.
Cells were treated with vehicle or 10nM or 100nM E2. RNA was harvested at 24 hours, and changes in mRNA levels were measured using quantitative RT-PCR. mRNA levels were normalized to control, histone 3a. Data are expressed as mean ± SEM (n = 4–10 independent experiments); *, P < .05; **, P < .01; and ***, P < .001. Statistical significance was determined by one-way ANOVA with Bonferroni's post hoc test.

