
Figure 2. AR and LuR expressions in FLCs.
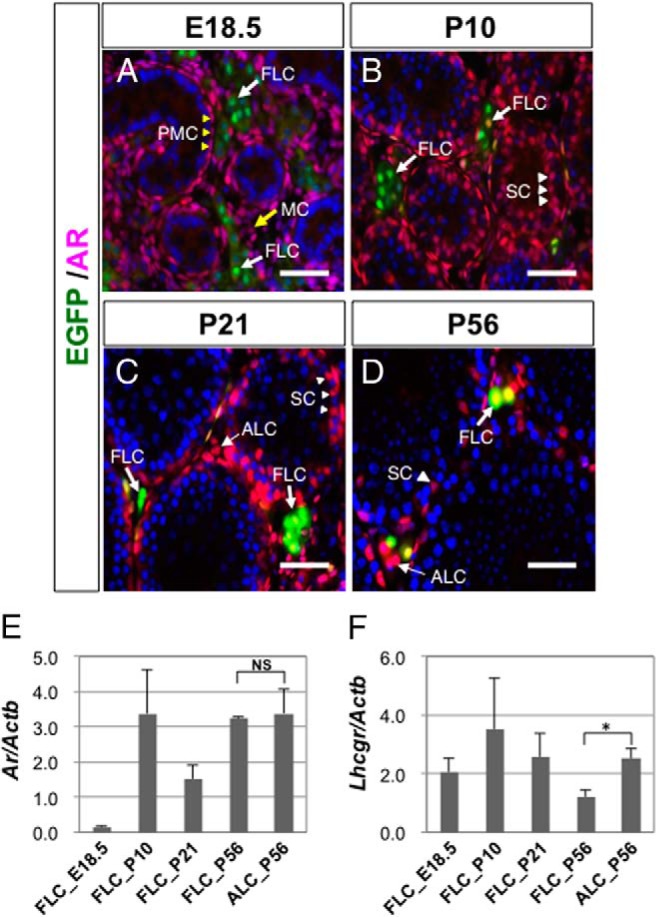
A–D, Testes were collected from wild-type mice at E18.5, P10, P21, and P56 and subjected to immunofluorescence analyses with antibodies against EGFP (green) and AR (red). EGFP-positive FLCs are indicated by bold arrows in A–D, whereas EGFP-negative interstitial cells (putative ALCs) are indicated by thin arrows in C and D. The peritubular myoid cells (PMCs) and mesenchymal cells (MCs) in the fetal testis are indicated by yellow arrowheads and yellow arrows in A, respectively. Sertoli cells (SCs) are indicated by arrowheads in B–D. Scale bars, 50 μm. E and F, FLCs were collected from mFLE-EGFP mouse testes at E18.5, P10, P21, and P56 by cell sorting, and the expression levels of Ar and Lhcgr were measured by qRT-PCR. ALCs were collected from P56 wild-type testes by Percoll density gradient centrifugation and also subjected to the analyses. The expression levels of Ar and Lhcgr were standardized by the β-actin (Actb) expression levels. The data are shown as mean ± SEM. *, P < .05, significant difference. NS, no significant difference.