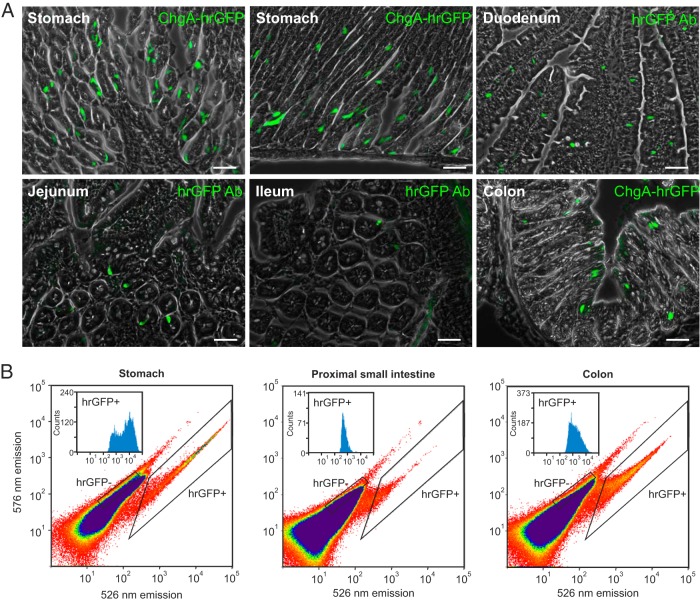
Figure 2. ChgA promoter-driven hrGFP expression in the GI tract.
A, Fluorescence microscopy showing ChgA promoter-driven hrGFP fluorescence in the stomach (no hrGFP antibody), hrGFP-labeled cells in the duodenum, jejunum, ileum, and ChgA promoter-driven hrGFP fluorescence in the colon (no hrGFP antibody). Scale bars, 50 μm. B, Representative FACS diagrams showing the separation of hrGFP negative and positive cells based on fluorescence emission at 526 vs 576 nm after excitation with 488 nm for stomach, proximal small intestine, and colon. In each plot, the distribution of the fluorescence intensity among the cells in the hrGFP-positive pool is shown.

