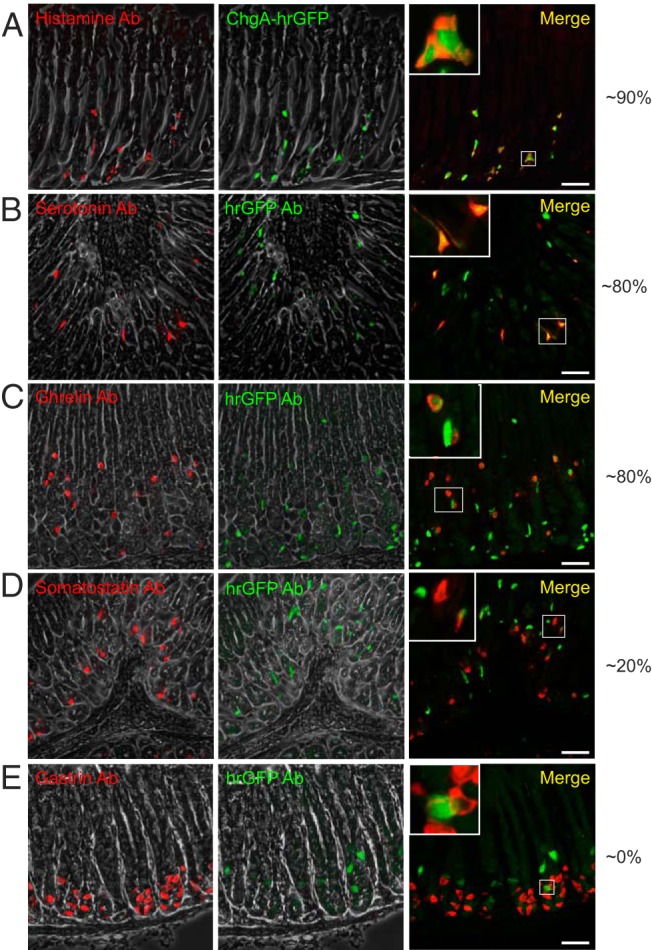
Figure 4. Colocalization of ChgA promoter-driven hrGFP expression and hormone immunoreactivity in gastric tissue.

Fluorescence microscopy showing (A) histamine, (B) serotonin, (C) ghrelin, (D) somatostatin, or (E) gastrin immunoreactivity (red) and ChgA promoter-driven hrGFP fluorescence (green) (or hrGFP immunofluorescence for the somatostatin and gastrin staining) in gastric tissue (scale bars, 50 μm). Merged pictures to the right also contain magnifications of selected cells showing colocalization or lack of so. The numbers to the right represent estimates of the percentages of the cell subtypes that colocalize with hrGFP.
