
Figure 7. Colocalization of ChgA promoter-driven hrGFP expression and ChgA or hormone immunoreactivity in pancreatic islets.
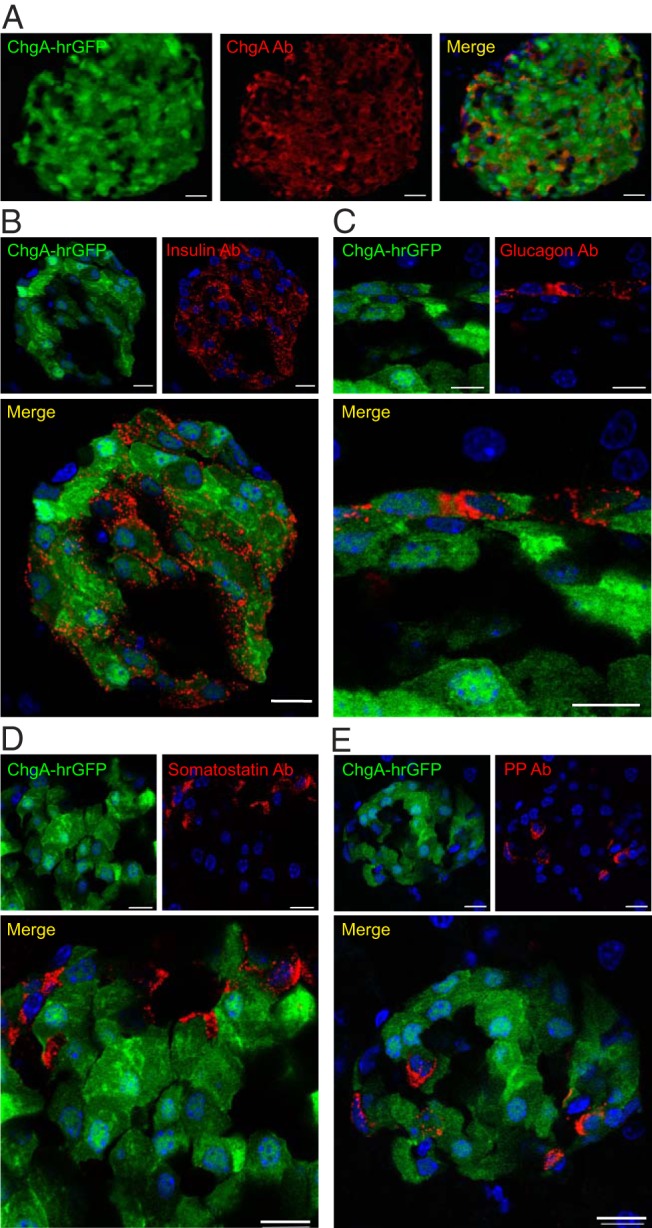
A, Fluorescence microscopy showing ChgA promoter-driven hrGFP fluorescence (green) and ChgA (Ab from Abcam) immunoreactivity (red) in a pancreatic islet (scale bar, 50 μm). Confocal microscopy showing ChgA promoter-driven hrGFP fluorescence (green) and insulin immunoreactivity (red) (scale bars, 10 μm) (B), or glucagon immunoreactivity (red) (scale bars, 5 μm) (C), somatostatin immunoreactivity (red) (scale bars, 5 μm) (D), or PP immunoreactivity (red) (scale bars, 10 μm) (E). Nuclei staining was made with DAPI (blue).