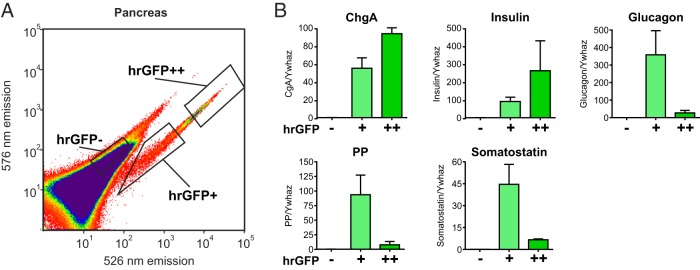
Figure 8. qPCR analysis of FACS-purified pancreatic hrGFP cells.
A, FACS diagram showing gates used to sort pancreatic hrGFP negative cells, positive cells with relatively low fluorescence intensity (hrGFP+), and positive cells with relatively high fluorescence intensity (hrGFP++) based on fluorescence emission at 526 vs 576 nm after excitation with 488 nm. B, qPCR analysis of the expression of ChgA, insulin, glucagon, PP, and somatostatin in the different pools of cells (n = 3).

