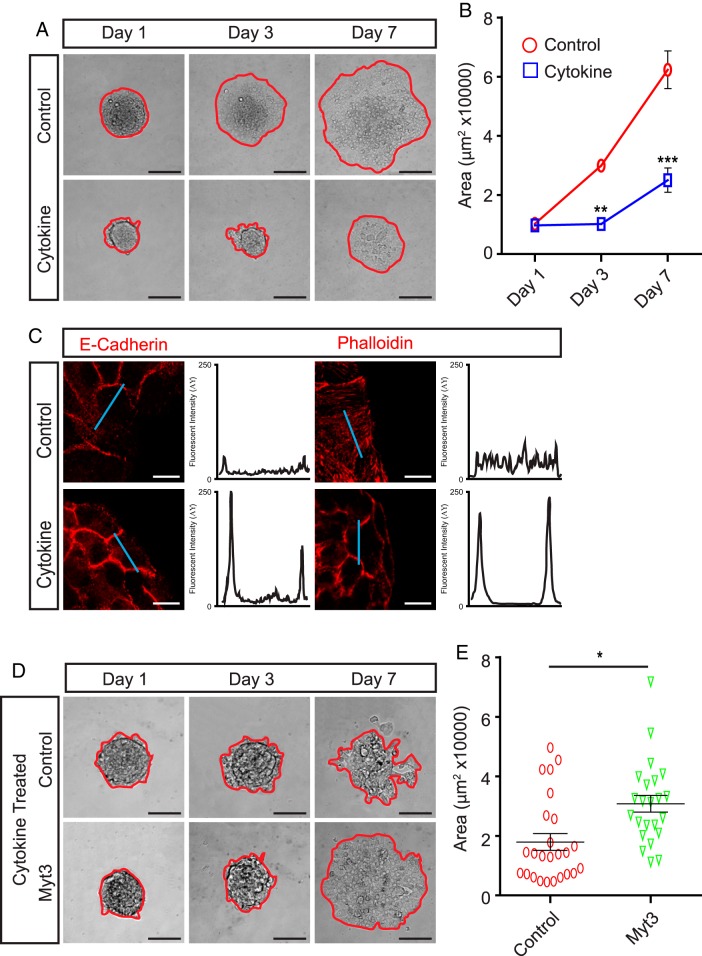
Figure 4. Cytokine exposure inhibits islet-cell migration.
A, Representative images of control or cytokine-treated islets cultured for 1, 3, and 7 days on 804G. The red line indicates the islet boundary. B, Quantification of islet area for islets in A. The data represent mean values from at least 3 experiments with 10 islets per experiment. C, Control and cytokine-treated islets were stained for E-cadherin (red) and phalloidin (red) to mark F-actin after 3 days in culture. Histograms show signal intensity along a line segment (blue line) drawn through the cell. D, Representative images of cytokine-treated, control-, or Myt3-transduced islets cultured for 1, 3, and 7 days on 804G. The red line indicates the islet boundary. E, Scatter plot of islet area for individual islets from D. Data from 3 independent experiments is represented. Sample means ± SEM are indicated by the black lines. *, statistically significant difference at P ≤ .05; **, P ≤ .01; ***, P ≤ .001. Scale bars, 100 μm.

