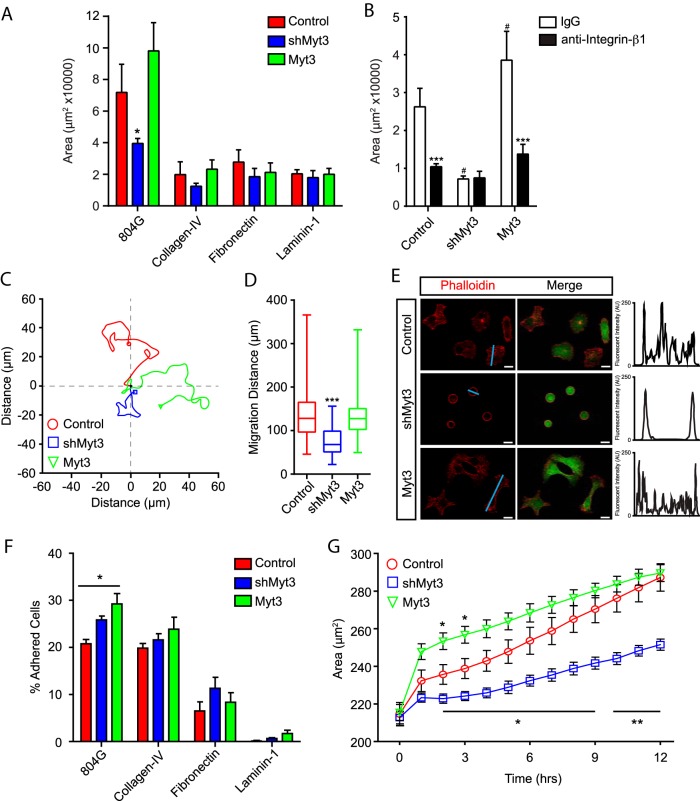
Figure 6. Myt3-mediated islet-cell migration and spreading are dependent on laminin-V and integrin-β1.
A, Islet area was quantified for control-, shMyt3-, or Myt3-transduced islets cultured for 7 days on the indicated ECMs. The data represent mean values from at least 3 experiments with 10 islets per experiment. B, Islet area was quantified for transduced islets treated with control IgG or antiintegrin-β1 blocking antibody for 7 days. The data represent mean values from at least 3 experiments with 10 islets per experiment. C, Representative traces of cell migration paths for transduced, dispersed islets cultured on 804G for 7 days. D, Box-whisker plots representing cumulative migration distance for transduced, dispersed islets cultured on 804G for 7 days. E, Representative images of phalloidin (red)-stained transduced, dispersed islets cultured on 804G for 7 days. GFP (green) indicates transduced cells. Histograms show signal intensity along a line segment (blue line) drawn through the cell. F, Quantification of the number of transduced, dispersed islet cells remaining on the indicated ECM after a 2-hour incubation and subsequent wash. The data represent mean values from 5 independent experiments and are presented as a percentage of starting cells. G, Average cell size over time for transduced, dispersed islet cells plated on 804G. Scale bars, 10 μm.

