
Figure 1.
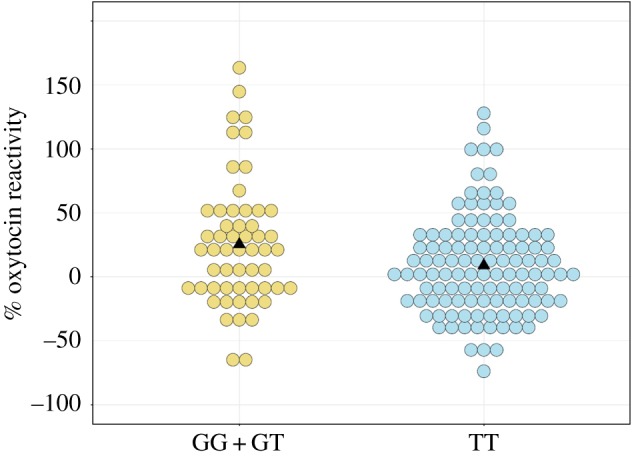
Dot plot indicating percentage change in salivary oxytocin for individuals with GG + GT versus TT genotypes for GTF2I SNP rs13227433. Each dot represents one individual. Triangles indicate the mean for each genotype group (25.4 for GG + GT, 8.8 for TT).