Figure 2.
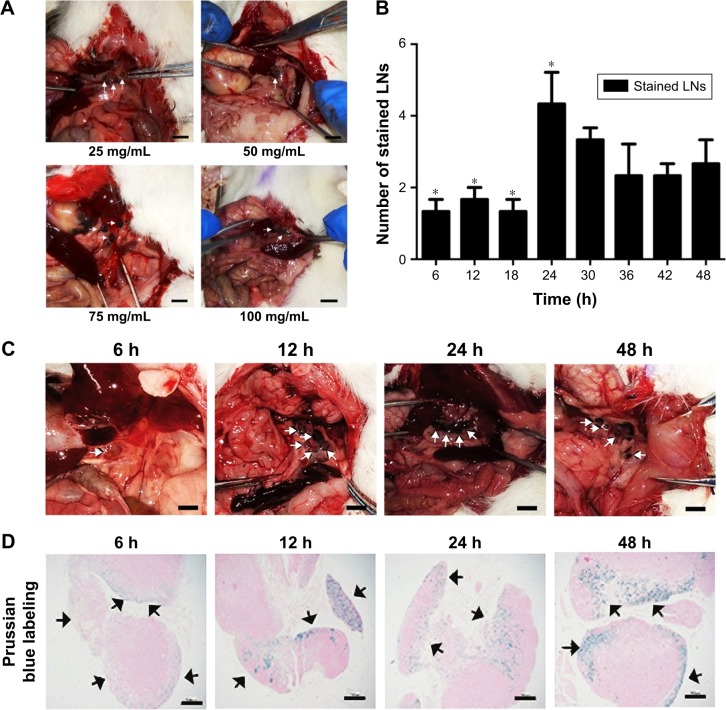
In vivo LNs mapping.
Notes: (A) Different concentrations (25, 50, 75 and 100 mg/mL) of DIONs were injected to explore an appropriate concentration for LN mapping. The scale bars indicate 1 cm. (B) The number of stained LNs. The maximum number of stained LNs at 24 h (4.33±1.53, *P<0.05). Comparison of numbers at different times indicate statistically significant differences (F=3.354, P<0.05). (C) The labeling effect of 75 mg/mL DIONs from 6 to 48 h. The scale bars indicate 1 cm. The pictures (A), (B) and (C) were recorded using a Canon digital camera, and white arrows point out the stained LNs. (D) Prussian blue-stained tissue slices of the stained LNs. Black arrows point out the blue stained iron in the LNs. The photos were recorded using a fluorescence microscope (IX-70; Olympus). The scale bars indicate 40 μm.
Abbreviations: LNs, lymph nodes; DIONs, dextran-coated iron oxide nanoclusters.

