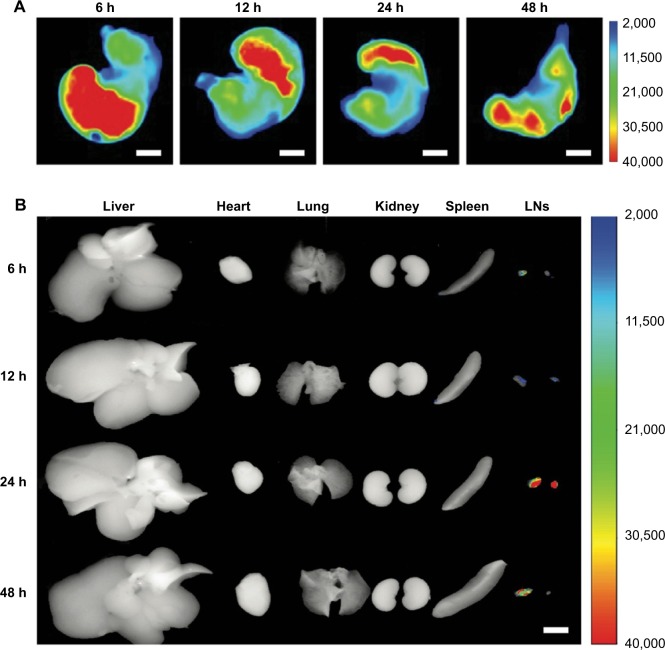
Figure 4.
Evaluation of in vivo biodistribution.
Notes: (A) The dynamic distribution of drugs after rats’ gastric submucosal layer was injected from 6 h to 48 h. (B) The rats’ perigastric LNs and major organs were excised and imaged. Images produced by in vivo fluorescence imaging system (Carestream In-Vivo Imaging System FXPRO). The scale bars indicate 1 cm.
Abbreviation: LNs, lymph nodes.

