. 2016 Oct 10;43(2):238–245. doi: 10.1097/DSS.0000000000000939
© 2016 by the American Society for Dermatologic Surgery, Inc. Published by Wolters Kluwer Health, Inc. All rights reserved.
This is an open-access article distributed under the terms of the Creative Commons Attribution-Non Commercial-No Derivatives License 4.0 (CCBY-NC-ND), where it is permissible to download and share the work provided it is properly cited. The work cannot be changed in any way or used commercially without permission from the journal.
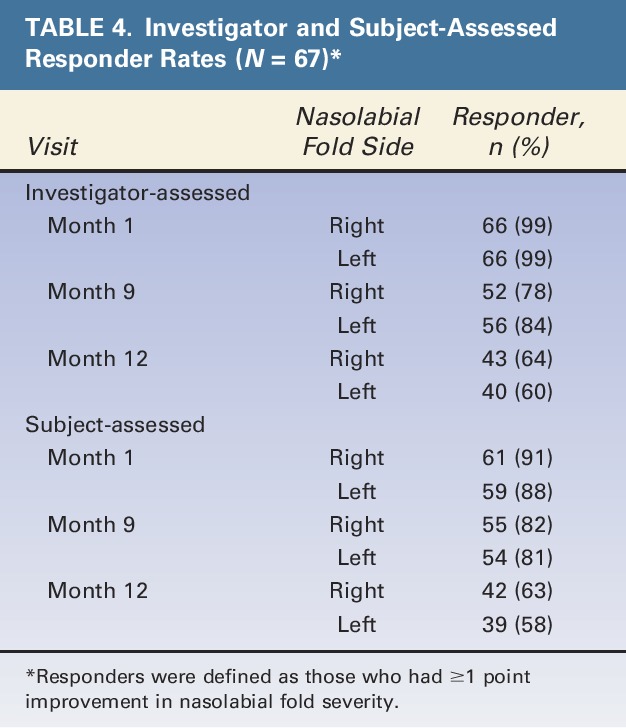
TABLE 4.
Investigator and Subject-Assessed Responder Rates (N = 67)*