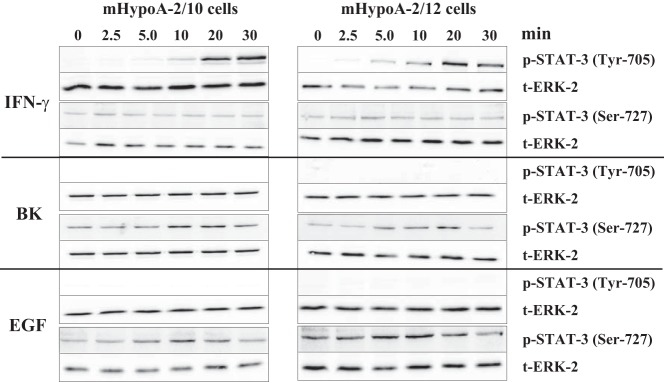
Figure 3. Ligand-induced STAT-3 phosphorylation.
mHypoA-2/10 and -2/12 cells were serum starved for 16 hours and then stimulated with IFN-γ (10 ng/mL), BK (1 μM), or EGF (10 ng/mL) for the indicated time period. Cell lysates were subjected to Western analysis using a phospho-specific antiserum against either Tyr-705 or Ser-727. In each case the same blot was also analyzed with an antiserum against the total ERK-2 protein (t-ERK-2) to control for the total protein amount. One representative blot is shown. Data from 5 independent experiments are given in Table 1.

