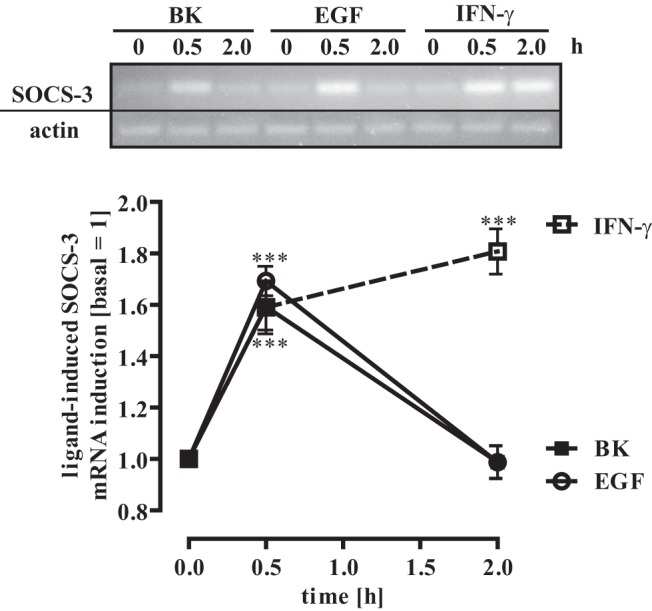
Figure 6. EGF, BK, and IFN-γ induce SOCS-3 expression.

mHypoA-2/12 cells were serum starved for 16 hours and then stimulated for 30 or 120 minutes with EGF (10 ng/mL), BK (1 μM), or IFN-γ (10 ng/mL). SOCS-3 (40 cycles) or β-actin (30 cycles) mRNA expression was determined by RT-PCR. One representative blot is shown. Blots were quantified by densitometry, SOCS-3 expression was normalized to β-actin expression, and the time point zero is set to 1.0. Data are given as means ± SEM from 5 independent experiments, and asterisks indicate a significant difference from time point zero (1.0).
