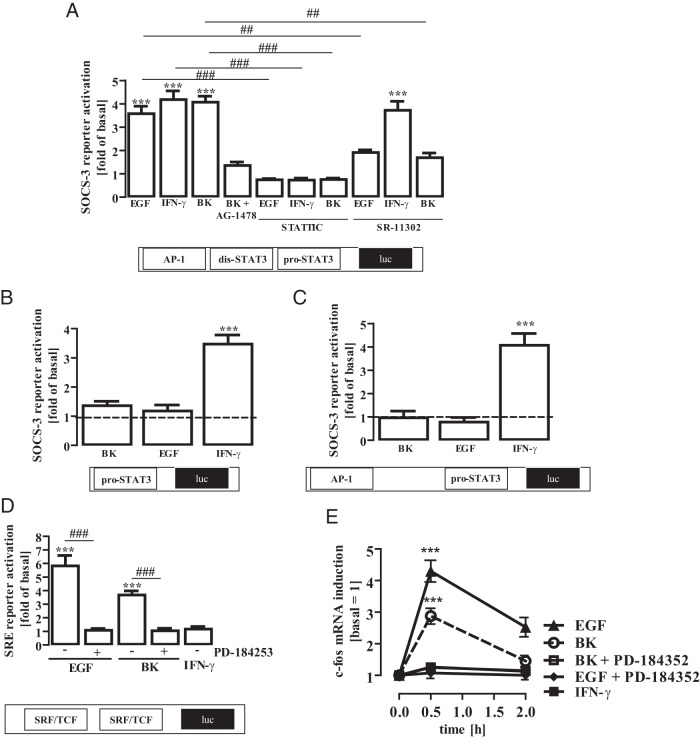
Figure 7. Regulation of the SOCS-3 promoter by distinct STAT-3 activating stimuli.
A, mHypoA-2/12 cells were transfected with a SOCS-3 reporter gene construct containing AP-1, the distal dis-STAT-3 (5′-TTCCAGGA-3′) and the proximal pro-STAT-3 site (5′-TTACAAGAA-3′), serum starved for 16 hours, preincubated for 1 hour with the STAT-3 inhibitor STATTIC (10 μM) or the AP-1 inhibitor SR-11 302 (1 μM), and then stimulated with IFN-γ (10 ng/mL), EGF (10 ng/mL), or BK (1 μM) for 6 hours. Data from 5 independent experiments performed in quadruplicate were compiled and are expressed as means ± SEM. Asterisks indicate a significant difference from basal (1.0) and hash signs from untreated cells. B, mHypoA-2/12 cells were transfected with a SOCS-3 reporter gene mutant lacking the AP-1 and the distal dis-STAT-3 site, serum starved for 16 hours, and then stimulated with IFN-γ (10 ng/mL), EGF (10 ng/mL), or BK (1 μM) for 6 hours. Data from 5 independent experiments performed in quadruplicate were compiled and are expressed as means ± SEM. Asterisks indicate a significant difference from basal (1.0). C, mHypoA-2/12 cells were transfected with a SOCS-3 reporter gene mutant containing the AP-1 and the proximal pro-STAT-3 site, serum starved for 16 hours, and then stimulated with IFN-γ (10 ng/mL), EGF (10 ng/mL), or BK (1 μM) for 6 hours. Data from 5 independent experiments performed in quadruplicate were compiled and are expressed as means ± SEM. Asterisks indicate a significant difference from basal (1.0). D, mHypoA-2/12 cells were transfected with an SRF/TCF-dependent reporter gene construct, serum starved for 16 hours, preincubated for 30 minutes with PD-184253 (10 μM), and then stimulated with IFN-γ (10 ng/mL), EGF (10 ng/mL), or BK (1 μM) for 6 hours. Data from 5 independent experiments performed in quadruplicate were compiled and are expressed as means ± SEM. Asterisks indicate a significant difference from basal (1.0) and hash signs from untreated cells. E, mHypoA-2/12 cells were serum starved for 16 hours, preincubated for 30 minutes with PD-184253 (10 μM), and then stimulated for 30 or 120 minutes with EGF (10 ng/mL), BK (1 μM), or IFN-γ (10 ng/mL). c-fos (40 cycles) or β-actin (30 cycles) mRNA expression was determined by RT-PCR. Blots were quantified by densitometry, c-fos expression was normalized to β-actin expression, and time point zero was set to 1.0. Data are given as means ± SEM from 5 independent experiments, and asterisks indicate a significant difference from time point zero.

