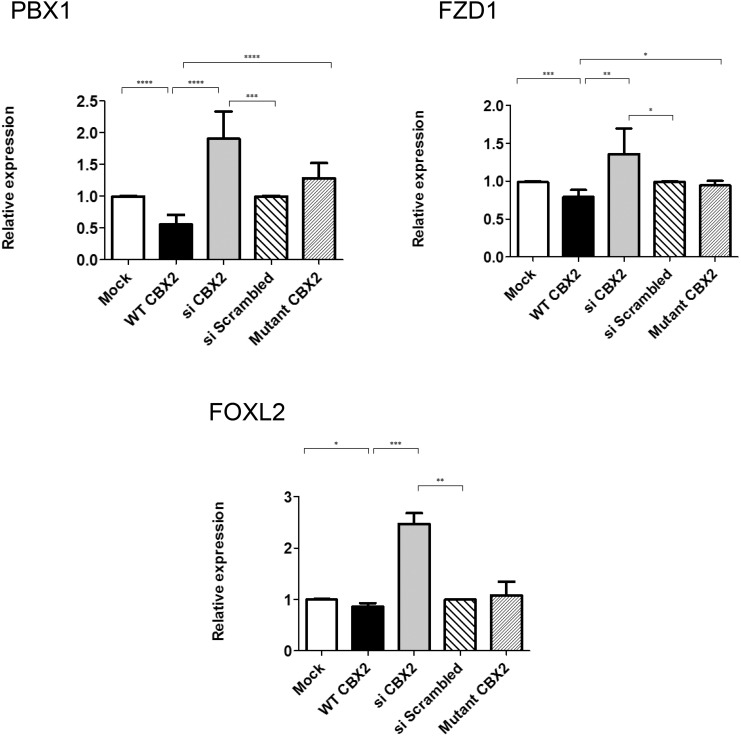
Figure 5. Genes down-regulated in a CBX2-dependent manner.
qRT-PCR quantification of mRNA levels for putative CBX2 targets that are down-regulated by CBX2. NT2–D1 was treated as in Figure 4. CBX2 overexpression (black) decreased the relative expression of PBX1, FOXL2, and FZD1, compared with cells transfected with empty vector (white). Upon CBX2 knockdown (gray), the relative expression of PBX1, FOXL2, and FZD1 were up-regulated upon comparing with scrambled siRNA (wide lines). Transfecting the cells with equimolar amounts of the mutated forms (P98L and R443P) of CBX2 (narrow lines) showed no effect on the relative expression of all the target genes compared with control. The data in all graphs are the average of 3 independent experiments, error bars represent SD, and values are expressed as relative to control = 1. ****, P < .0001; ***, P < .001; **, P < .01; *, P < .05.

