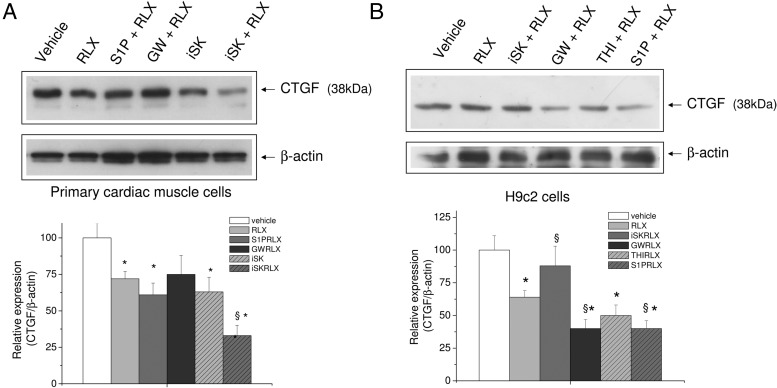
Figure 7. Effect of SphK, SMase, and S1P lyase inhibition and extracellular S1P on CTGF expression in H9c2 cells.
A and B, Western blot analysis of CTGF protein expression was performed by using cell lysates (15–30 μg) from untreated primary cardiac muscle cells (A) and H9c2 cardiomyoblasts (B) or treated for 30 minutes with indicated agents (5μM compound II [iSK], 10μM GW9846, 6.5μM THI, or 1μM S1P) and then with vehicle or RLX (50 ng/mL) for 24 hours. Band intensity, reported as relative percentage of the ratio between CTGF/β-actin, normalized to control, set as 100, is shown in the graphic. A blot representative of at least 3 independent experiments with similar results is shown. Data are mean ± SEM (Student's t test; *, P < .05 vs untreated cells (vehicle); §, P < .05 vs RLX).

