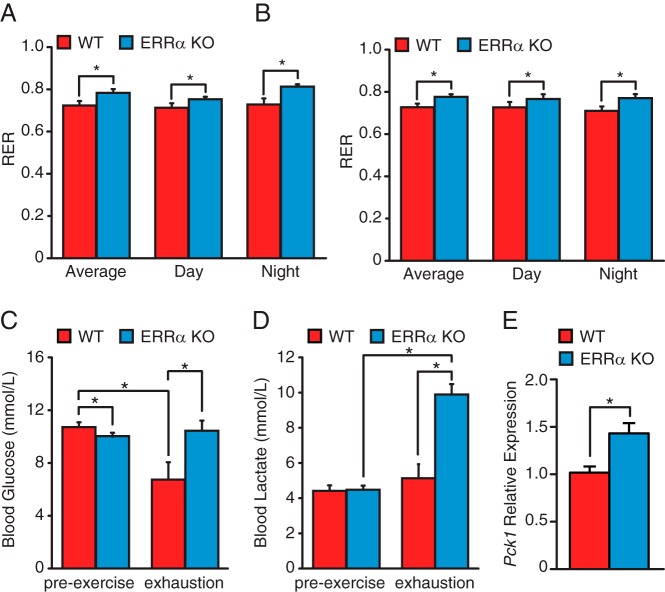
Figure 4. Increased use of carbohydrates for energy production in ERRα-KO mice.
A and B, The RER in male (A) and female (B) mice was measured during a 24-hour period by indirect calorimetry in WT and ERRα-KO mice. C and D, Blood glucose (C) and lactate (D) levels in WT and ERRα-KO male mice before and after exercise. Data are expressed as means ± SEM; n = 8 mice per group. *, P < .05 by unpaired t test. E, qRT-PCR analysis of hepatic Pck1 expression in WT and ERRα-null mice under basal conditions. Data are normalized to Rplp0 levels and expressed as means ± SEM. *, P < .05 by unpaired t test.

