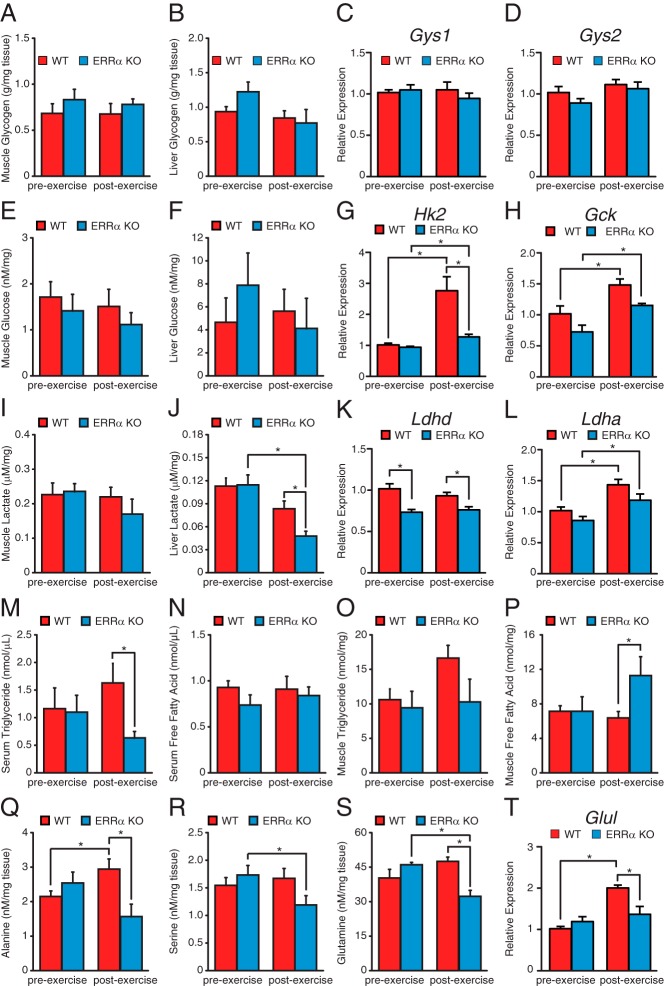
Figure 6. Measurement of fuel sources in WT and ERRα-null mice before and after exercise.
A and B, Quantification of muscle (A) and liver (B) glycogen levels in WT and ERRα-KO mice before and after exercise. C and D, qRT-PCR analysis of the predominant gastrocnemius (C) and liver (D) glycogen synthase gene in WT and ERRα-null mice before and after exercise. Data are normalized to Rplp0 levels and expressed as means ± SEM. E and F, Quantification of muscle (E) and liver (F) glucose levels in WT and ERRα-KO mice before and after exercise. G and H, qRT-PCR analysis of the predominant gastrocnemius (G) and liver (H) hexokinase gene in WT and ERRα-null mice before and after exercise. Data are normalized to Rplp0 levels and expressed as means ± SEM. *, P < .05 by unpaired t test. I and J, Quantification of muscle (I) and liver (J) lactate levels in WT and ERRα-KO mice before and after exercise. *, P < .05 by unpaired t test. K and L, qRT-PCR analysis of lactate dehydrogenase (LDH) genes in gastrocnemius (K) and liver (L) WT and ERRα-null mice before and after exercise. Data are normalized to Rplp0 levels and expressed as means ± SEM. *, P < .05 by unpaired t test. M–P, Quantification of circulating and skeletal muscle triglyceride and free fatty acids levels in WT and ERRα-KO mice before and after exercise. *, P < .05 by unpaired t test. Q–S, Quantification of skeletal muscle amino acid levels in WT and ERRα-KO mice before and after exercise. *, P < .05 by unpaired t test. T, qRT-PCR analysis of Glul expression in the gastrocnemius of WT and ERRα-null mice before and after exercise. Data are normalized to Rplp0 levels and expressed as means ± SEM. *, P < .05 by unpaired t test.

