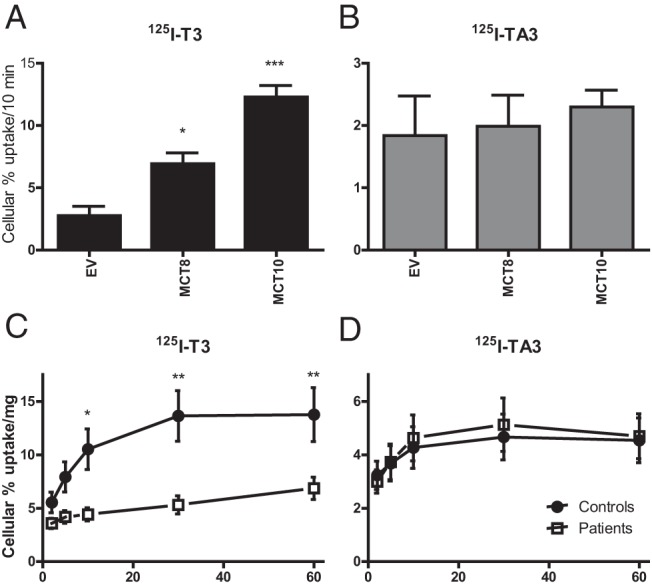
Figure 1. A and B, Cellular uptake of [125I]T3 (A) and [125I]TA3 (B) after 10 minutes in transiently transfected COS1 cells with pcDNA3 (empty vector [EV]) or hMCT8-pcDNA3 or hMCT10-pcDNA3.1.

Results are presented as mean ± SEM (n = 3). Significance represents empty vector vs MCT8 or MCT10 using 1-way ANOVA with Bonferroni posttest. C and D, Cellular uptake of [125I]T3 (A) and [125I]TA3 (B) after 2 to 60 minutes of incubation with fibroblasts from MCT8 patients or age- and gender-matched controls. Results are corrected for protein and presented as mean ± SEM (n = 5). Significance represents control fibroblast vs fibroblast of MCT8 patients using 2-way ANOVA with Bonferroni posttest. *, P < .05; **, P < .01; ***, P < .001.
