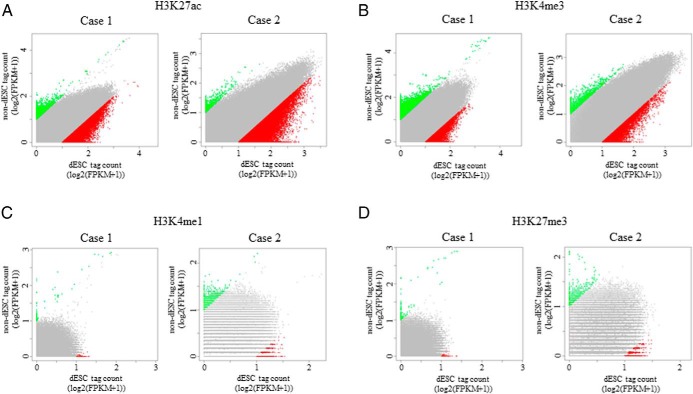
Figure 2. Changes of genome-wide histone modification statuses by decidualization.
Histone modification signals were searched in 1-kb intervals between −10 kb and +10 kb from the TTS, and then the difference in the signals between non-dESCs and dESCs was evaluated by the scatter plot of log2-transformed FPKM values. Regions showing more than a 2-fold increase (green dots) or decrease (red dots) in signals between non-dESCs and dESCs were defined as having increased or decreased histone modifications, respectively. Gray dots represent the regions showing less than 2-fold changes. Data from two individuals (case 1 and case 2) are shown.

