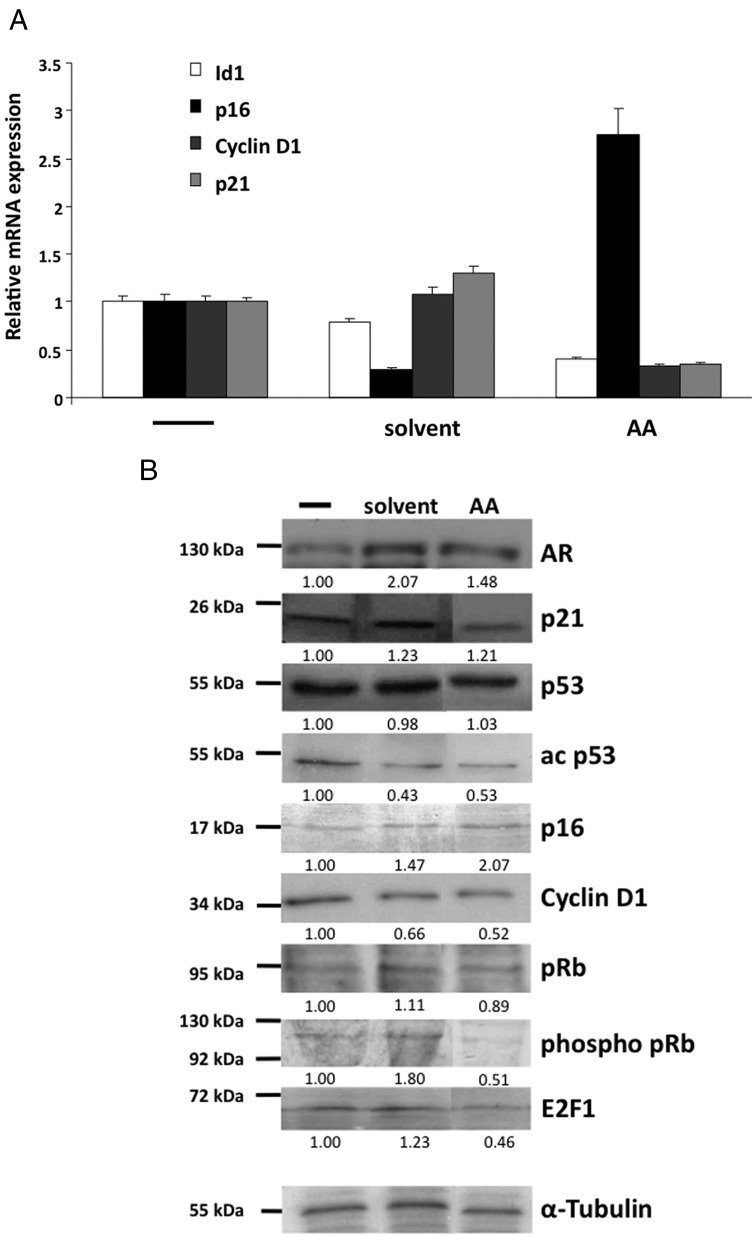
Figure 5. Treatment with AA modifies the expression of cell cycle regulators.
LNCaP cells were treated for 72 hours with a solvent control or 3 × 10⁻⁵ M AA to analyze cell cycle-regulating pathways. A, The mRNA expression of genes of interest was analyzed by qRT-PCR using specific primers for Id1, p21, p16, cyclin D1, and β-actin for normalization. Values of the untreated samples were set as 1. Error bars indicate the SEM of doublets. B, Protein levels were detected via Western blot and quantitatively analyzed using α-tubulin as a loading control. The quantified values are shown below the detected bands and are indicated as fold change compared with the untreated samples, which were set arbitrarily as 1.

