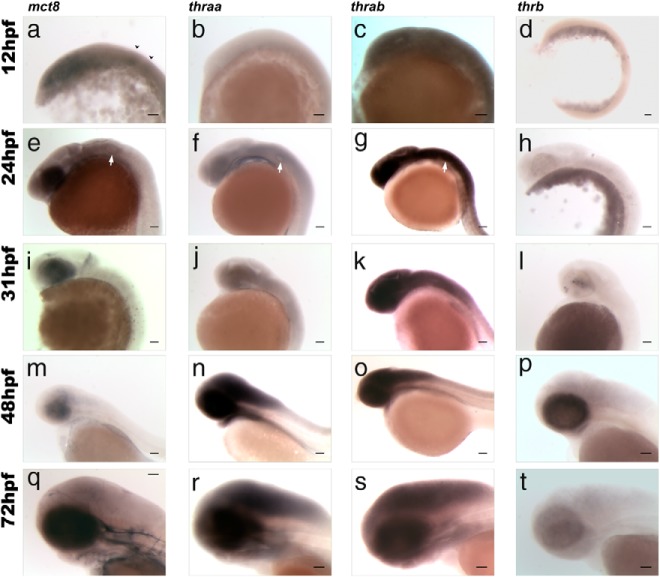
Figure 1.
Lateral views of zebrafish embryos at 12 (A–D), 24 (E–H), 31 (I–L), 48 (M–P), and 72 (Q–T) hpf showing results of WISH for expression of mct8 (A, E, I, M, and Q), thraa (B, F, J, N, and R), thrab (C, G, K, O, and S), and thrb (D, H, L, P, and T). In A, black arrowheads denote rhombomeres 3 and 5. In E, F, and G, white arrows indicate the otic vesicle. Scale bars, 100 μm.

