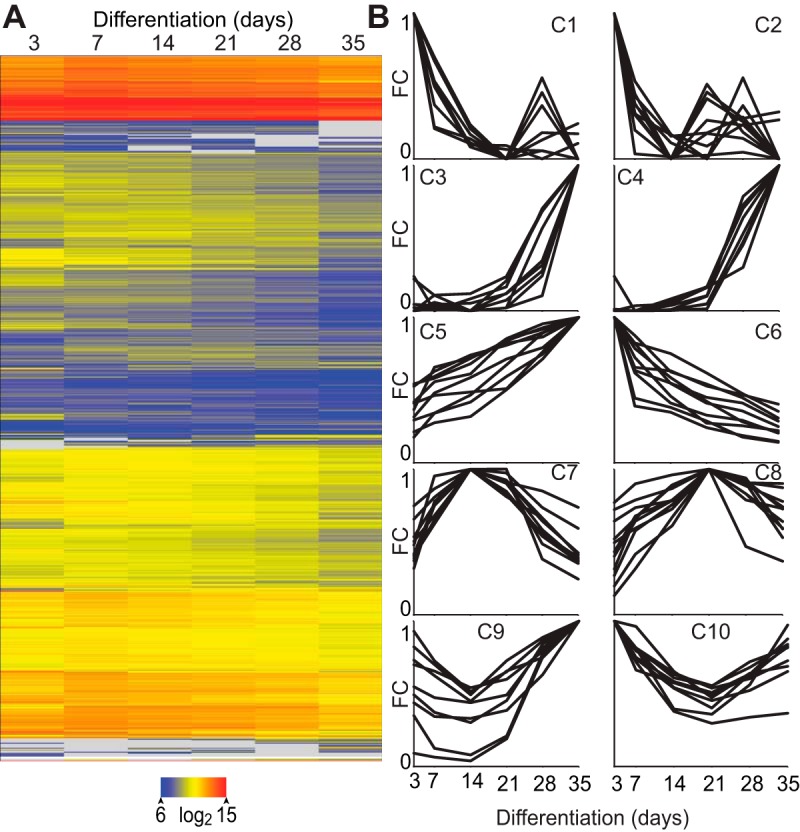
Figure 1.

The osteoblast to osteocyte transition is accompanied by global changes in the transcriptome. A, Heat map of gene expression during differentiation. B, Example profiles for 10 clusters of genes with similar gene expression patterns over differentiation plotted as fold change (FC) against indicated time point (FC = 1).
