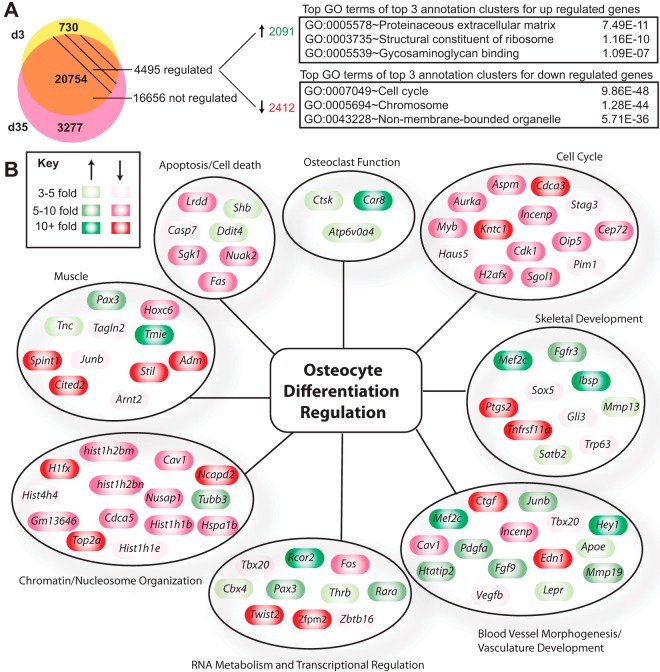
Figure 2.
The osteoblast to osteocyte transition is accompanied by global changes in the transcriptome. A, Venn diagram of genes expressed in the osteoblast (d3) only (yellow) and osteocyte (d35) only (pink) stage. Genes expressed at both time points (orange) are classified as regulated if their gene expression levels are changed by 2-fold or more during differentiation (d35 vs d3) with 95% confidence by a moderated t test. The top GO term from the top 3 annotation clusters from DAVID are shown with associated P values. B, Regulated genes from panel A were manually grouped by category and classified according to their degree of regulation (green, up-regulated; red, down-regulated). d3, day 3; d35, day 35.

