Figure 4.
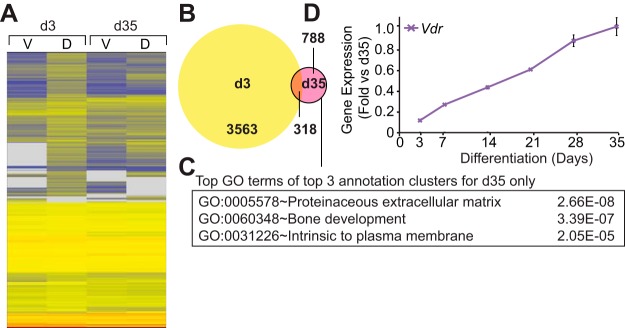
Osteocytes display a unique 1,25(OH)2D3-sensitive transcriptome. A, Heat map of regulated genes' expression in osteoblasts (d3) and osteocytes (d35) treated with vehicle (V) or 100 nM 1,25(OH)2D3 (D) for 24 hours. B, Venn diagram of 1,25(OH)2D3-regulated genes in the osteoblast (d3) and osteocyte (d35). C, The top GO term from the top 3 annotation clusters from DAVID are shown with associated P values. D, Gene expression (vehicle only) was normalized to β-actin levels and shown as fold change compared with d35 sample. Samples were analyzed in triplicate ± SEM. d3, day 3; d35, day 35.

