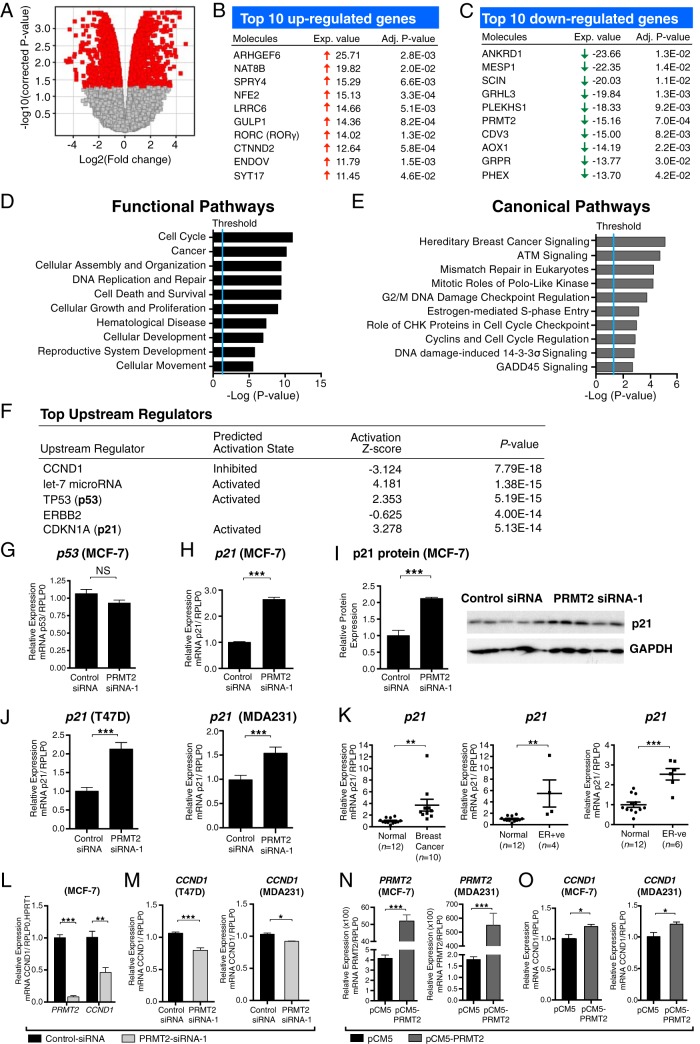
Figure 2.
PRMT2-dependent gene expression regulates multiple pathways involved in breast cancer. A, The volcano plot represents the magnitude of differential gene expression between control-siRNA transfected cells and PRMT2-siRNA-1 transfected cells (n = 4). Red indicates differentially expressed genes in a significant manner (P < .05). Top 10 up-regulated (B) or down-regulated (C) genes were presented with fold change and adjusted P value. Ingenuity analysis of Illumina microarray data after PRMT2 knockdown, showing the top ten functional (D) and canonical (E) pathways. F, Ingenuity analysis predicted top upstream regulators based on PRMT2-dependent gene expression changes. G and H, Real-time quantification of p53 and p21 in the control transfection and PRMT2 knockdown. RPLP0 endogenous control was used for normalization. Data are presented as the mean (SEM) of six transfected cultures. I, Western blot analysis shows p21 and GAPDH in MCF-7 cells after transfection with control-siRNA or PRMT2-siRNA-1 for 72 hours. Quantification of p21 protein expression from Western blot (n = 5). J, p21 expression was measured in T47D and MDA231 cells after control-siRNA or PRMT2-siRNA-1 transfected. RPLP0 was used for normalization. Data are presented as the mean (SEM) of six transfected cultures. K, p21 expression in IDC (n = 10) compared with normal breast tissues (n = 12). IDC samples separated into ER+ve (n = 4) and ER−ve (n = 6) subgroups were compared with normal breast tissues (n = 12). IPO8 endogenous control was used for normalization. L, Real-time quantification of PRMT2 and CCND1 from TLDA. Data are presented as the mean (SEM) of three transfected cultures. RPLP0 and HPRT1 were used for normalization. M, CCND1 mRNA was measured in control siRNA or PRMT2 siRNA-1 transfected T47D and MDA231 cells. Data are shown as the mean (SEM) of four transfected cultures. N, PRMT2 mRNA expression was measured by RT-qPCR in pCM5 or pCM5-PRMT2-transfected MCF7 and MDA231 cells. Data are presented as the mean (SEM) of four experiments. RPLP0 was used for normalization. O, CCND1 mRNA expression was measured by RT-qPCR in pCM5 or pCM5-PRMT2 transfected MCF7 and MDA231 cells. Data are presented as the mean (SEM) of four experiments.

