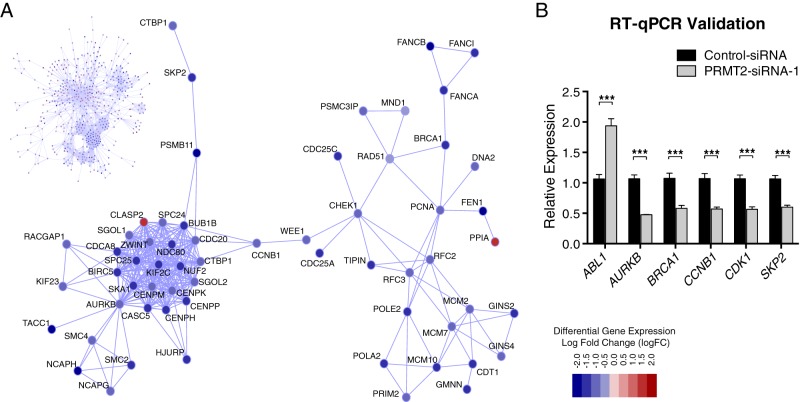
Figure 3.
Protein-protein interaction diagram of PRMT2-dependent genes depicting the identified optimal scoring subnetwork. A, The complete network is shown in the upper left section of Figure 3. A magnified portion of the subnetwork showing key functional interactions between gene members of the kinetochore and DNA repair pathways is also shown. PRMT2 mediated differential expression is designated by node coloring (red indicates up-regulation in PRMT2 knockdown cells, whereas blue indicates down-regulation in PRMT2 knockdown cells). The legend provides a map between node coloring and log fold change of expression. B, MCF-7 cells were transfected with control siRNA or PRMT2 siRNA-1 for 48h (n = 6). RNA was harvested and analyzed by TaqMan RT-qPCR to detect expression of ABL1, AURKB, BRCA1, CCNB1, CDK1, and SKP2. Results are shown as relative expression levels that were normalized to RPLP0. Data are presented as the mean (SEM) of six transfected cultures. Significance was calculated using a two-way ANOVA with Tukey's multiple comparison test.

