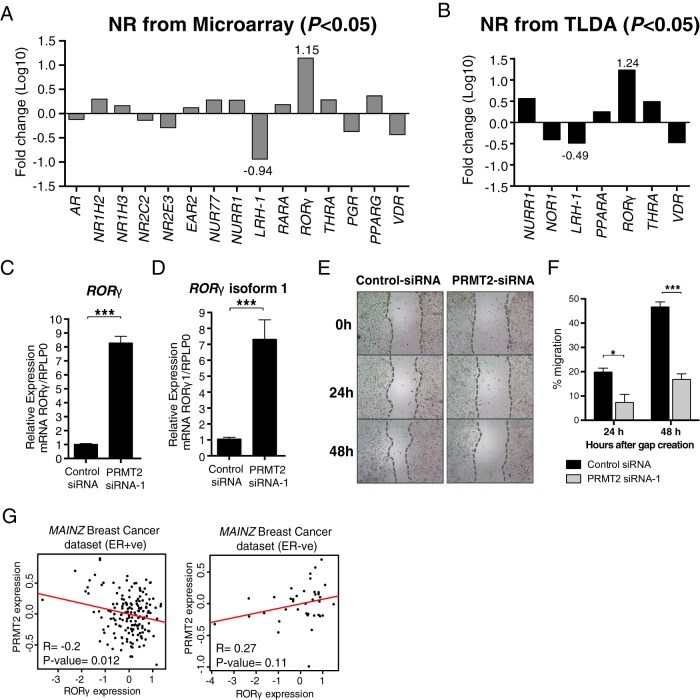
Figure 4.
PRMT2 expression regulates the expression of the NRs, LRH-1 and RORγ and affects breast cancer cell migration. A, Fold changes of nuclear receptors were presented in log10 scale from microarray data (P < .05). B, TLDA was used for relative quantification of nuclear receptors (n = 6). Benjamini-Hochberg multiple testing correction was conducted with Integromics Statminer software package. For normalization, selected geNorm controls (GAPDH, GUSB, and UBC) were used. Fold changes of nuclear receptors were presented in log10 scale from TLDA (P < .05). Relative gene expression level was determined for total RORγ (C) and RORγ1 (D) using Taqman gene expression assay (Applied Biosystems) normalized to RPLP0. Data are presented as the mean (SEM) of six transfected cultures. E, Wound-healing assay was performed at 0, 24, and 48 hours after wound initiation with ×4 magnification. F, Percentage of migration was quantified relative to 0 hour time point. Significance was calculated using a two-way ANOVA with Tukey's multiple comparison test. G, An inverse correlation between PRMT2 and RORγ expression. Scatter plot of PRMT2 and RORγ expression pattern in MAINZ breast cancer data set. A linear regression line was presented in red color. The coefficient of correlation (R) was calculated using the cor.test function of the stats package.

