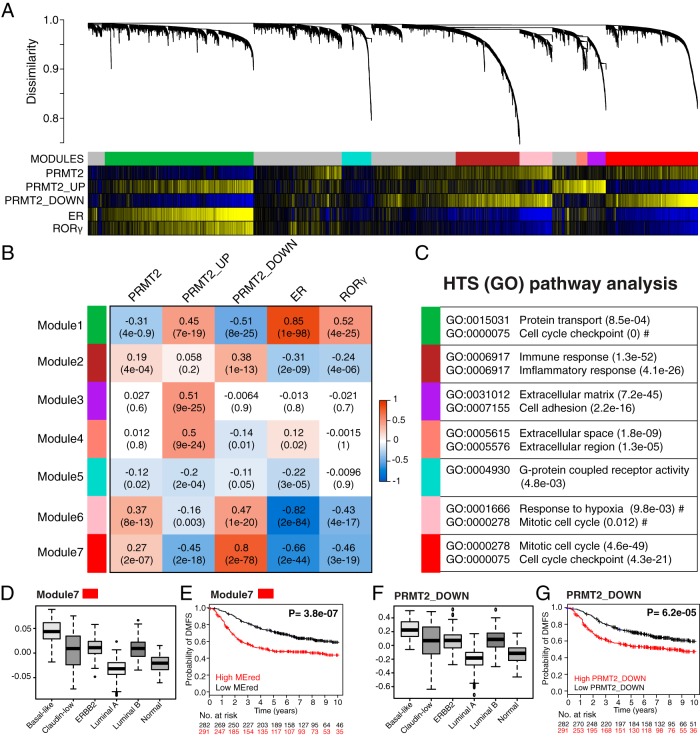
Figure 7.
WGCNA revealed multiple coexpression modules in breast cancer cohorts, illustrating an inverse correlation between PRMT2 and RORγ. A, Cluster dendrogram generated by hierarchical clustering of genes on the basis of topological overlap. Modules of correlated genes were assigned colors. All unassigned genes were placed in the gray module. Pairwise correlations were calculated for each gene to PRMT2 gene expression levels, PRMT2_UP mean expression scores, PRMT2_DOWN mean expression scores, ER gene expression levels, and RORγ gene expression levels. The P value significance is shown as a colored bar and was a significant correlation (P < .05, yellow), and a significant anticorrelation (P < .05, blue) is indicated for each gene. The module7/red exhibits significant correlation to PRMT2 gene expression levels and PRMT2_DOWN mean expression scores. In contrast, the module7/red shows significant anticorrelation to the PRMT2_UP mean expression scores, ER gene expression levels, and RORγ gene expression levels. B, Heat map showing statistical significance of correlation between the identified modules and expression scores/levels. Pearson correlation and Student's asymptotic P value for correlation are provided in each cell. Dark orange represents positive correlation and azure blue represents negative correlation. C, GO terms most enriched in the identified module. D, Box plot showing relative module eigengene values for the module7/red across the intrinsic breast cancer subtypes. A Kruskal-Wallis value of P < 0.01 was observed. E, K–M estimate for patients exhibiting high module eigengene values for the module7/red (red line) vs those exhibiting low module eigengene values (black line). A significant log rank test value of P < .01 was obtained. F, Box plot showing PRMT2_DOWN signature values across the intrinsic breast cancer subtypes. A Kruskal-Wallis value of P < .01 was observed. G, K–M estimate for patients exhibiting high average expression score of PRMT2_DOWN signature values (red line) vs those exhibiting low average expression score of PRMT2_DOWN signature values (black line). A significant log rank test value of P < .01 was obtained.

