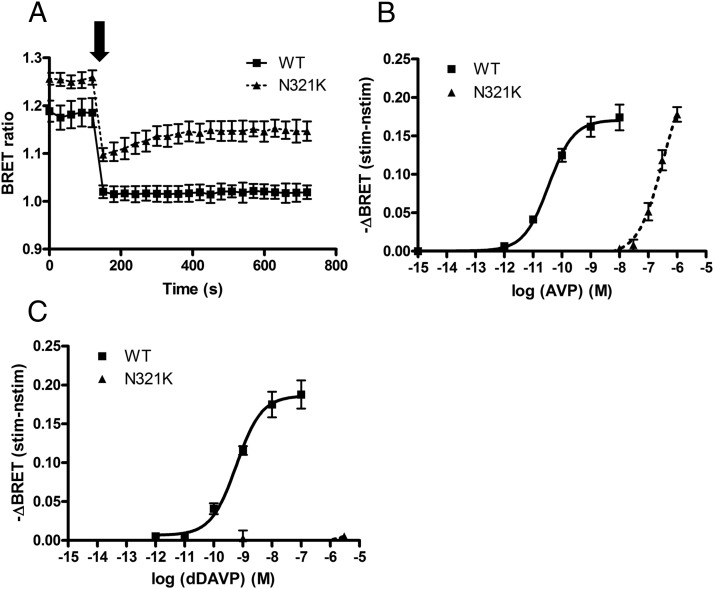
Figure 3.
Measurement of the cAMP signal upon AVP and dDAVP stimuli. HEK293 cells were transiently transfected with the WT-V2R or the N321K-V2R and the Epac-BRET sensor. After 24 hours, the BRET measurements were implemented. A, Cells were stimulated with 10 nM AVP for the WT receptor (■) and with 1 μM AVP for the mutant receptor (▴) at the indicated time. B and C, Dose-response curve of AVP (B) and dDAVP (C). The effect of the hormone on the WT-V2R– and N321K-V2R–expressing HEK293 cells was calculated as the BRET ratio difference between the ligand (stim)–treated and the vehicle (nstim)–treated cells at the first time points after the treatment. Mean values ± SE are shown (n = 3).

